
(Click on image to enlarge)
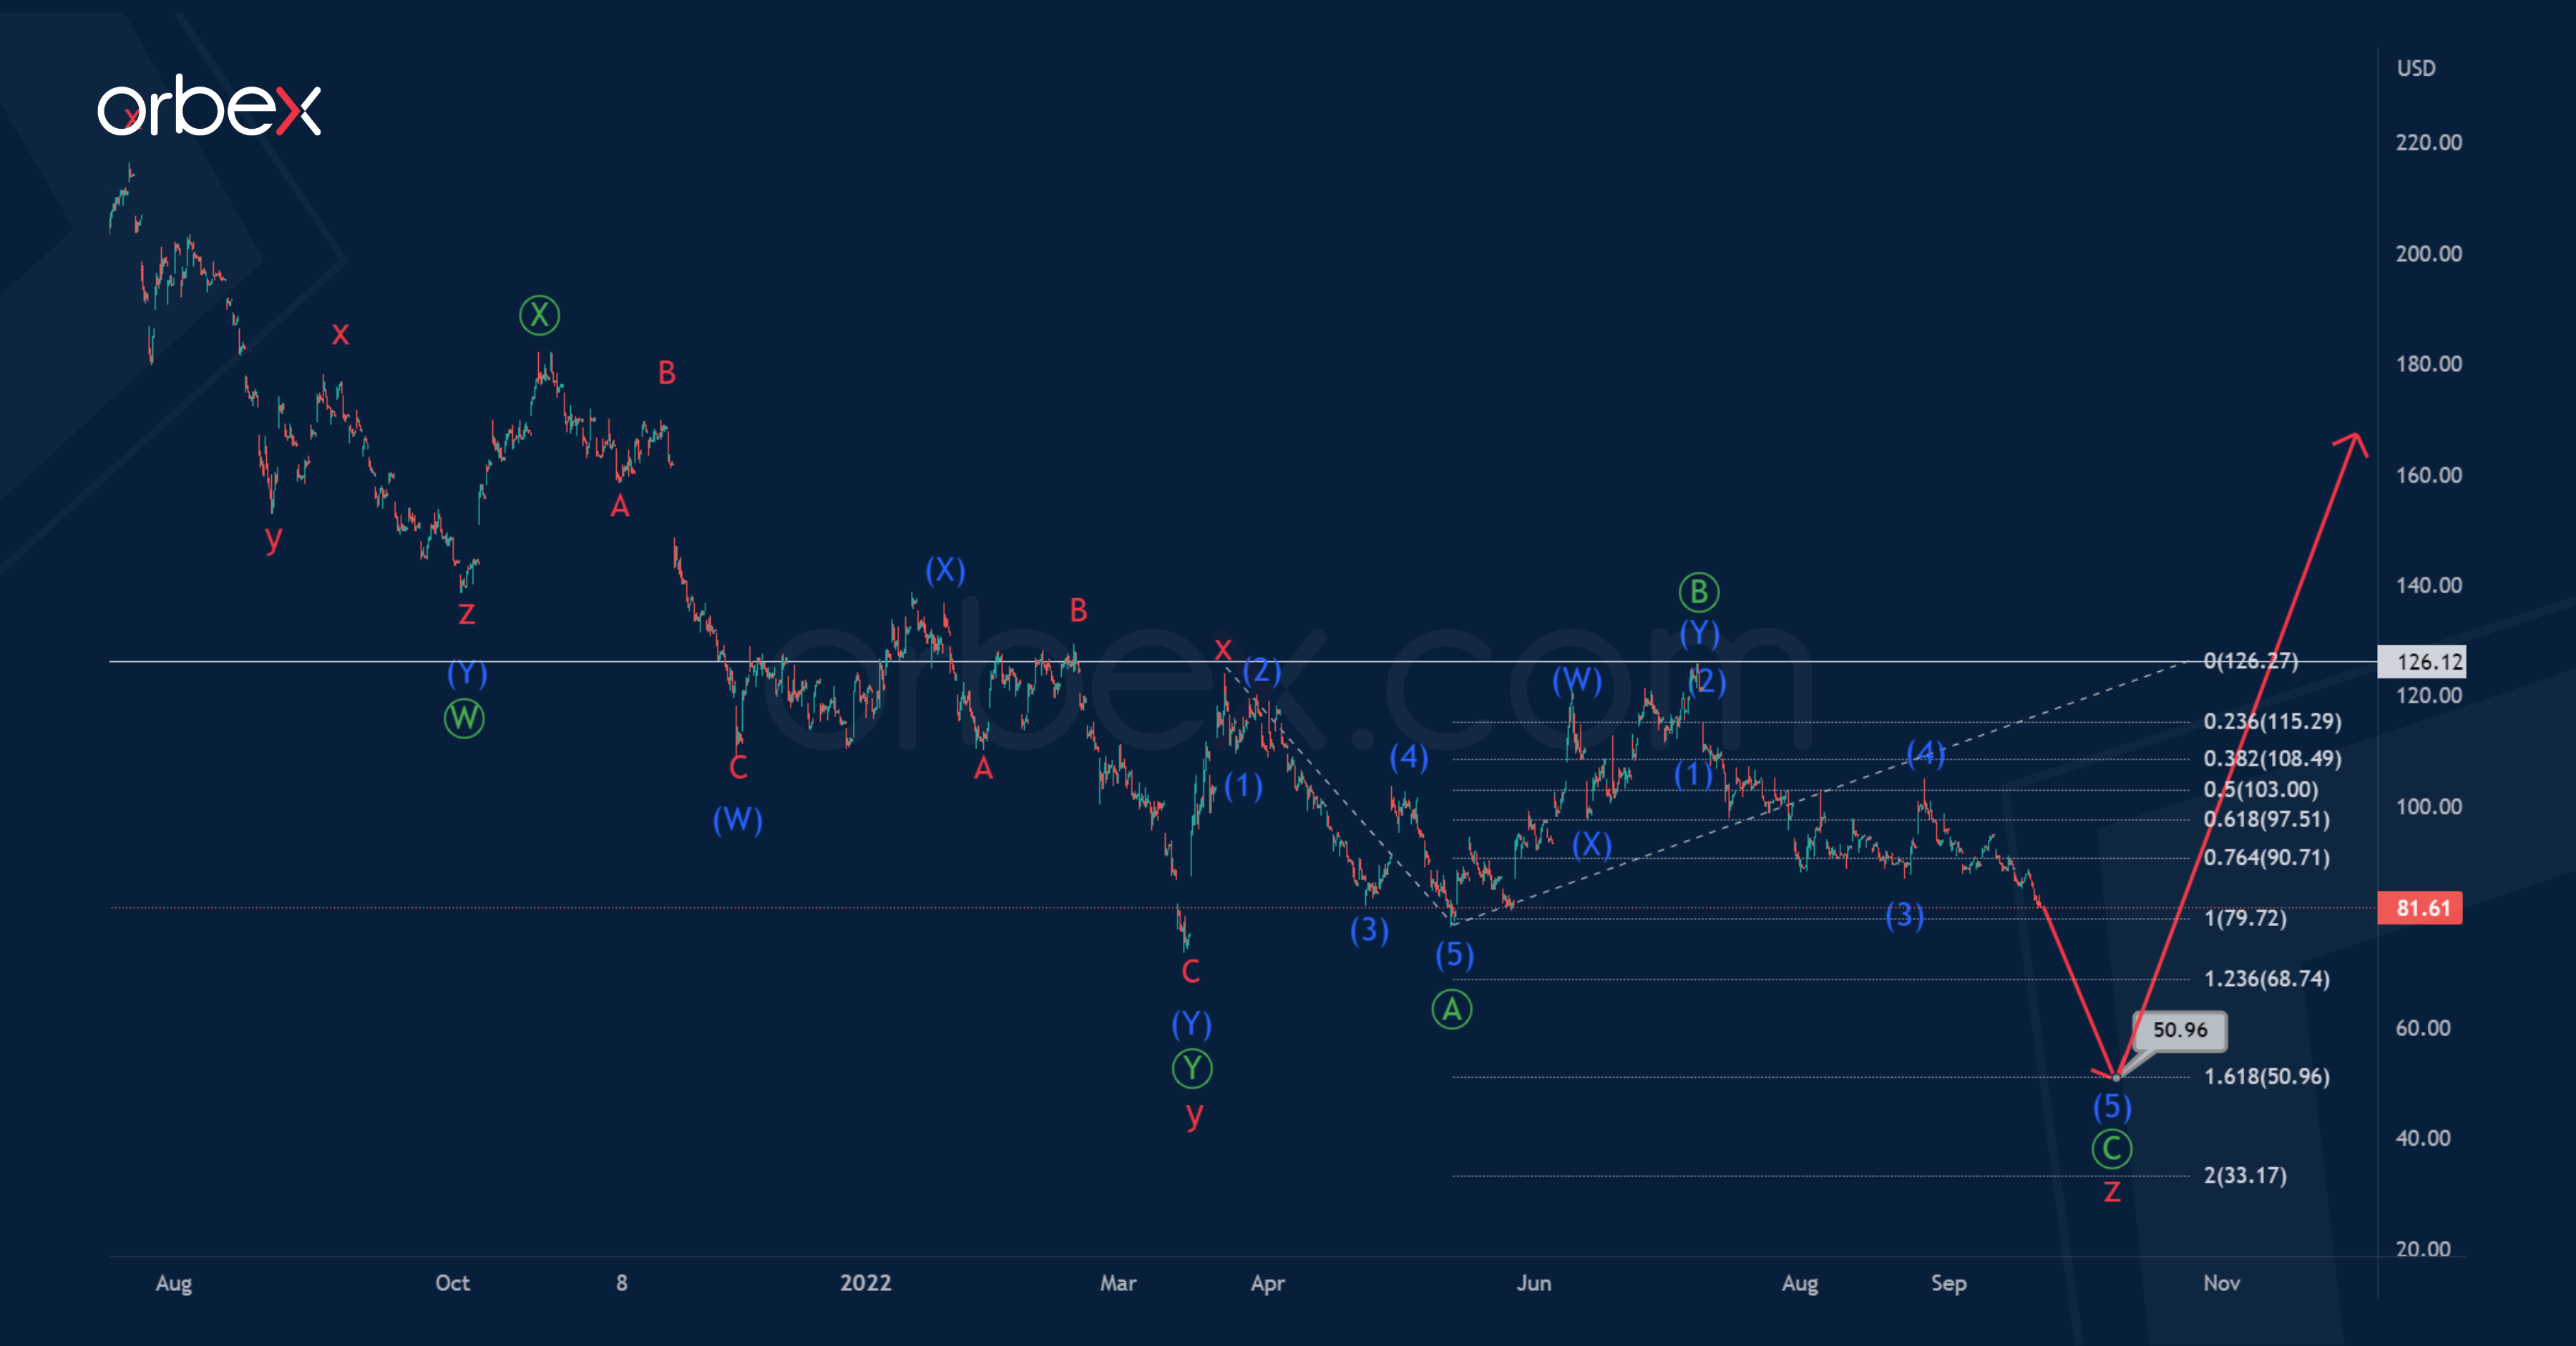
The current chart of Alibaba Group (BABA) shares shows the formation of a bearish corrective trend. This takes the form of a cycle triple zigzag w-x-y-x-z.
Currently, we see a completed actionary wave y which has the form of a primary double zigzag Ⓦ-Ⓧ-Ⓨ, and a second small intervening wave x.
Now the formation of the final actionary wave z is taking place. This takes the form of a primary standard zigzag Ⓐ-Ⓑ-Ⓒ, as shown in the chart.
The primary wave Ⓐ ended as an (1)-(2)-(3)-(4)-(5) impulse, with the correction wave Ⓑ being a intermediate double zigzag (W)-(X)-(Y). Soon, stocks could continue to fall in the primary wave Ⓒ in the form of impulse (1)-(2)-(3)-(4)-(5) to 50.96. At that level, primary impulse wave Ⓒ will be at 161.8% of impulse Ⓐ.
(Click on image to enlarge)

Another scenario shows a situation in which the formation of a cycle intervening wave x continues.
The intervening wave x will likely form a double zigzag Ⓦ-Ⓧ-Ⓨ of the primary degree. The first two zigzag sub-waves Ⓦ-Ⓧ look finished.
Now the price is in the wave Ⓨ. It is assumed that this wave will also have a standard zigzag structure (A)-(B)-(C), as shown in the chart.
The growth of the shares should be expected to 150.24. At that level, cycle intervening wave x will be at 38.2% of actionary wave y.
More By This Author:
Intraday Market Analysis – Gold Stays Under Pressure
What To Expect From The BOE’s Rate Decision
XAGUSD Bearish Correction B Could Reach 15.05
Comments
Log in or sign up to join the conversation.