
AZO And ORLY: Which One Is A Better Buy?
By Price Earnings Ratio Tracker Team
Over recent months I have created valuation models for the two main competitors in the auto parts retail business – AutoZone, the leader on the coasts with a $26 billion market capitalization at the time of writing, and the somewhat smaller in terms of sales, more Midwest oriented O’Reilly with a $28 billion market cap. My model was inspired by Aswath Damodaran’s corporate finance course. So if you had to choose the equity of just one of these companies to invest in, which would you buy?
If you follow along to the end, you will get a clear answer. But first, let’s look at some of the different characteristics of their equity that I fed into my net present value (NPV) valuation models. For each company, before I projected income statement and cash dynamics, I needed a cost of capital to discount the projected cash flows. So I first zeroed in on costs of debt and equity. In doing so my research led to points of contrast relevant to stockholders.
AZO and ORLY: Debt
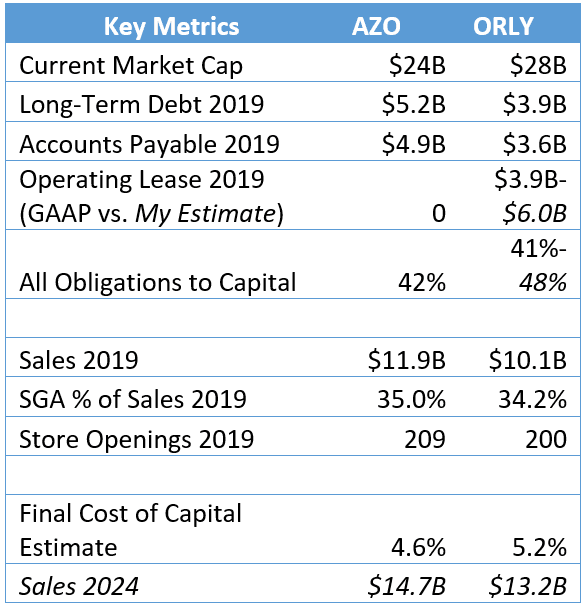
I found that both AZO and ORLY have similar long-term costs of debt: Debt coming due in 2027, for example, has an effective interest rate of 3.6% or 3.7%. At first glance, however, you would think O’Reilly would have a lower cost of debt. Its long-term-debt (as seen on its balance sheet) to capital ratio is lower than AutoZone’s. However, considering O’Reilly’s significant operating leases that include office space, retail stores and distribution centers changes the picture.
Both companies have the same credit rating, ranked BBB by S&P. This is lower than either of their interest coverage ratios would suggest. I think this is due to yet another factor: the very high amount of accounts payable both companies have on their books, likely to maintain robust, customer-pleasing inventories.
Considering debt, accounts payable and including ORLY’s operating leases as they appear on SEC filings, both companies are pretty similar in terms of capital structure, with such liabilities at just over 40% of total capital. Based on my analysis, both companies are at the right level of long-term debt to minimize their cost of capital. (My estimate of the operating lease liability is more conservative than the GAAP number, but lenders/credit agencies seem to prefer the latter.)
O’Reilly has less cash on hand or liquidity in the form of accounts payable. It has been investing in inventory in the short term. Because of this fact, AutoZone looks to be more stable financially.
Improving its liquidity seems to be one reason why O’Reilly wants to increase its debt borrowings. Indeed, the company seems to have been expanding its long-term debt at a level of $500 million a year and that pace will likely continue. Its LTD was at $3.9 billion at the end of its 2019 fiscal year.
At the same time, it also seems like O’Reilly is more motivated to buy back shares. In the fiscal year ended in 2020, O’Reilly will likely increase its share buybacks to levels ($1.7 billion) last seen in its fiscal year ended 2018. So despite generating less cash from operations, ORLY will likely outspend AZO to this end. Perhaps it should be more conservative due to its liquidity situation.
Cost of Equity
To get a sense of AutoZone and O’Reilly’s cost of equity, I ran a regression of these companies’ returns to investors versus the market’s returns (S&P 500) to get a measure of their Beta. Neither AZO or ORLY pay a dividend and the S&P 500 represents total returns. I found that over the past five years, AutoZone’s beta was .51 and O’Reilly’s was .65. This means O’Reilly has a higher cost of equity and is thus seen as riskier.
Still both companies have Betas lower than one. The returns of these company are actually more volatile than those of the S&P 500, but the returns are not strongly correlated with those of the S&P 500. That is why Beta, and thus the cost of equity, is lower than the market average. (Remember, Beta can be broken down into two main factors: stand-alone stock return volatility and correlation with the broader market.)
Geography
Besides the weaker liquidity situation, O’Reilly’s geographic footprint makes it look riskier relative to AutoZone in the eyes of investors and contributes to its higher Beta number.
AutoZone’s portfolio of stores across geographies is more biased towards the coastal urban centers that have stronger economies. It has commanding leads in terms of store count in New York and Pennsylvania where it has 201 and 198 stores, respectively. It also has about the double the number of stores in Florida (362) as O’Reilly (180).
Meanwhile, O’Reilly is beating AutoZone in store count in Missouri (200 O’Reilly stores), Minnesota (122), Washington (156) and Texas (690), though not as decisively.
Operating Efficiency
Having understood better the balance sheets, debt strategies, risk and geographic footprints of these companies, I moved on to factors that affect the income statements and cash flows of my models. I started with margins.
Both companies are very similar in their operating efficiency profile. The inventory turnover is at about the same level 3x. Both had operating margins at around 19% in the fiscal year ended in 2019.
There is a little nuance here, however. For the fiscal year that ended in 2019, AutoZone had slightly lower COGS (46.3% versus O’Reilly’s 46.9%). AutoZone had more sales so perhaps this is due to economies of scale.
However, O’Reilly had lower SGA margins (34.2% versus AutoZone’s 35.0%), despite the operating lease costs here. So O’Reilly has a slight edge when it comes to controlling overhead. Wages are an important factor, and O’Reilly operates in lower-cost states.
Taxes
AutoZone seems to have a lower effective tax rate than O’Reilly, which in the fiscal years ended 2018 and 2019 paid somewhat more than the 21% mandated by federal law in 2017.
Capex
Though a smaller company by revenues, capital expenditures are trending higher at O’Reilly than at AutoZone. O’Reilly expects $675 million capex for the fiscal year ended in 2020, much of it inefficiency improvements like new IT hardware and trucks. AutoZone will likely see about $500 million.
AZO and ORLY: Growth Outlook
O’Reilly had a higher revenue growth rate than O’Reilly in the fiscal year ended in 2019. This trend will likely continue in the coming years, supported by strong capital expenditures.
These companies operate in a market niche backed by a strong secular growth trend. O’Reilly has seen comparable sales growth since it went public in 1993. Cars in the US are aging, and their parts will need to be replaced. (These companies are not as reliant on economic cycles as auto manufacturers.)
Summary
Plugging all the information I collected into discounted cash flow models, both of these companies seem like good buys when their NPV is calculated. The stocks are both trading at significant discounts based on future projected cash flows and on the cost of capital I have estimated. Both offer a good form of diversification as these stocks are largely uncorrelated to the S&P 500.
Based on my work, AutoZone stock is trading at a 60% discount of NPV to market capitalization. O’Reilly is trading at a 58% discount. So AutoZone is the winner here and receives a strong buy recommendation.
So not only is it relatively more expensive, O’Reilly seems slightly riskier based on its short-term investments in capex and inventory and its higher Beta. Also, its operating leases may be understated. For more conservative investors, O’Reilly stock is worth revisiting in two or three years to see how investments have panned out.
There is one case where you might prefer O’Reilly. If you can’t devote $1,100 for a share of AutoZone, you may be out of luck. But O’Reilly is trading at only about $400 at the time of writing.
You could have also saved yourself a lot of this complex financial analysis by looking at the P/E ratios. AutoZone is cheaper there as well.
I prefer to use the Price Earnings Ratio Stock Value Tracker app to compare 18 stocks that account for about a third of the value of the S&P 500. Please click here for more information or search for the app in the Google Play store.
This article first appeared on ValueWalkPremium
Disclaimer: This article is not an investment recommendation, more


