
Atlantica Yield - Chart Of The Day
Summary
- 100% technical buy signals.
- 18 new highs and up 7.18% in the last month.
- 48.67% gain in the last year, plus a 6.08% yield.
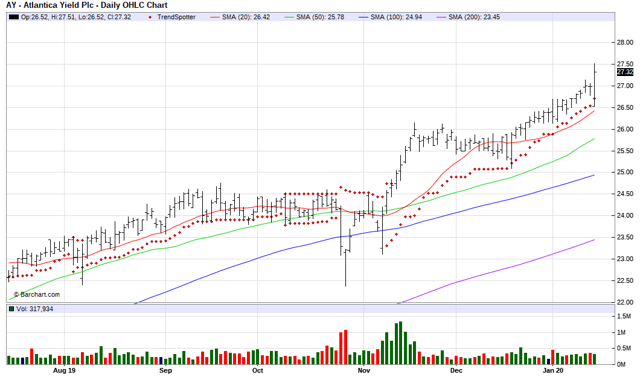
The Barchart Chart of the Day belongs to the utility company Atlantica Yield (AY). I found the stock by using Barchart's powerful screening tool to find stock with not only a Weighted Alpha of over 50+ but also technical buy signals over 80%. I sorted that list by the most frequent number of new highs in the last month, then used the Flipchart feature to review the charts for consistent price appreciation. Since the Trend Spotter signaled a buy on 11/12 the stock gained 9.35%.
Atlantica Yield plc acquires, owns, and manages renewable energy, natural gas power, electric transmission lines, and water assets in the United States, Mexico, Peru, Chile, Uruguay, Spain, Algeria, and South Africa. As of December 31, 2018, it had 24 assets, including 1,496 megawatts (MW) of renewable energy generation assets comprising solar power and wind plants; 300 MW of natural gas power generation assets that produce electricity and steam from natural gas; 1,152 miles of electric transmission lines; and water desalination plants with an aggregate capacity of 10.5 million cubic feet per day. The company was formerly known as Abengoa Yield plc and changed its name to Atlantica Yield plc in May 2016. Atlantica Yield plc was founded in 2013 and is based in Brentford, the United Kingdom.
(Click on image to enlarge)
Barchart's Opinion Trading systems are listed below. Please note that the Barchart Opinion indicators are updated live during the session every 10 minutes and can, therefore, change during the day as the market fluctuates. The indicator numbers shown below, therefore, may not match what you see live on the Barchart.com website when you read this report.
Barchart technical indicators:
- 100% technical buy signals
- 50.25+ Weighted Alpha
- 48.67% gain in the last year
- Trend Spotter buy signal
- Above its 20, 50 and 100 day moving averages
- 18 new highs and up 7.18% in the last month
- Relative Strength Index 75.46%
- Technical support level at 26.82
Fundamental factors:
- Market Cap $2.74 billion
- Dividend yield 6.08%
- Revenue expected to grow 7.80% this year and another 7.40% next year
- Earnings estimated to increase 45.20% this year, an additional 83.60% next year and continue to compound at an annual rate of 49.50% for the next 5 years
- Wall Street analysts issued 2 strong buy, 1 buy and 1 hold recommendation on the stock
- The individual investors following thew stock on Motley Fool voted 12 to 3 that the stock will beat the market
- 3,945 investors are monitoring the stock on Seeking Alpha
Disclosure: None.


