
As inflation burst onto investor’s radars, so did rising interest rates. And this combination has hurt growth stocks.
And in particular, it’s hurt technology stocks and key market leaders like semiconductors.
This isn’t the first time that we highlighted this key sector and why investors should be cautious and watchful of the Semiconductors. You can find our recent and past articles here.
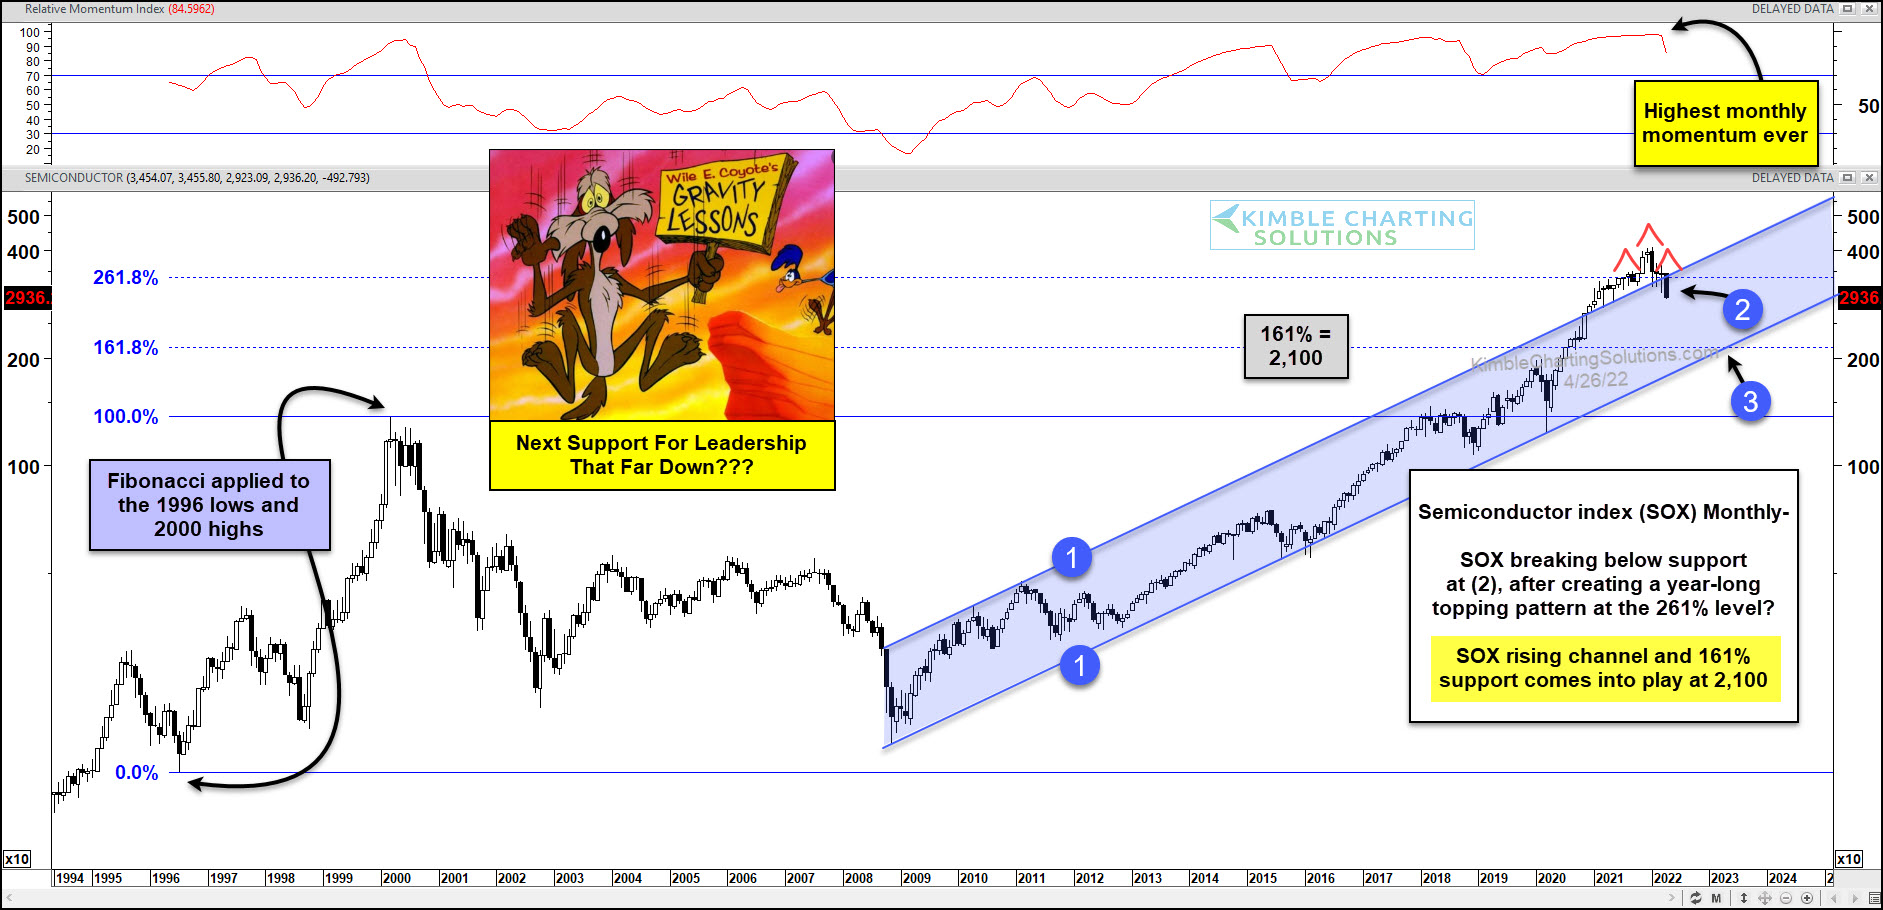
Today’s chart highlights the 13+ year up-trend channel that the Semiconductors Index (SOX) has been in marked by each (1). We can even see that the SOX briefly broke out above overhead channel resistance, hitting its 261.8% Fibonacci extension level.
BUT the Semiconductors formed a year-long topping pattern and have recently broken below support at (2). And this comes after the SOX recorded its highest EVER level of momentum. Yikes!
Could the next stop be at the 161.8% Fibonacci level and lower price channel support at 2100? That’s a long ways from current prices!!
(Click on image to enlarge)


Comments
Log in or sign up to join the conversation.