
Are P/E's A Problem?

The State of the Market
There is nothing terribly new to report in terms of the current stock market drivers. Traders appear to remain focused on the state of the COVID pandemic and the economic recovery, as well as the potential for additional stimulus out of Washington D.C. In addition, we should note that stocks remain overbought on all three time-frame views (short-, intermediate-, and long-term) and investor sentiment has reached extreme levels.
This combination suggests that the table is set for some sort of pause or pullback in the near-term but that the bulls are likely to retain possession of the ball from a bigger-picture standpoint. Yet, favorable seasonality, window dressing, and FOMO could easily keep a bid under stocks through year-end. We shall see.
Some Big Picture Thoughts
During my weekend research work, I came across two charts that I thought were worth sharing. First up, is a chart showing the consensus estimates for S&P 500 operating earnings for each calendar year plotted over time.
(Click on image to enlarge)
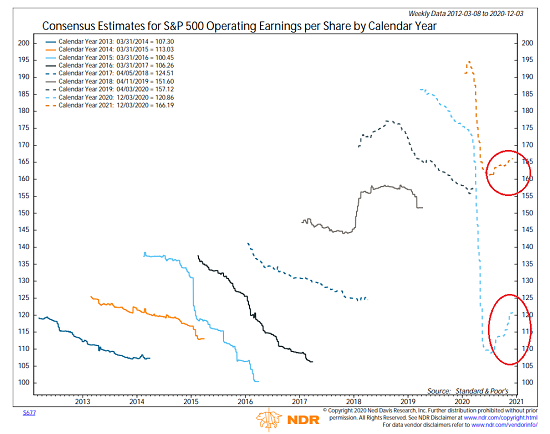
Source: Ned Davis Research
Two things caught my eye here. First, it is interesting to note that the trend of analyst estimates is fairly consistent in most years. The estimates for the upcoming year (which usually begin to take shape in Q3 of the current calendar year) start off too high and then are adjusted lower over time. This trend is clear for calendar years 2013, 2014, 2015, 2016, 2017, and 2019.
In 2018, the trend reversed due to the Tax cuts. And then in 2020 and 2021, analysts took a hatchet to estimates in response to the economic damage caused by the COVIC shutdown.
The good news is (a) the trend of estimates for both 2020 and 2021 are now moving higher and (b) 2021 estimates are higher than 2019's. As such, it makes some sense that stock prices are higher now compared to where they were at the end of 2019.
Using this rather simplistic approach, it can be argued that the stock market isn't as "divorced from reality" as many have argued.
The next chart is also likely to cause some spirited "discussion" as it shows the S&P 500 and the average 12-month operating earnings on the top clip and the operating P/E ratio on the lower clip.
(Click on image to enlarge)
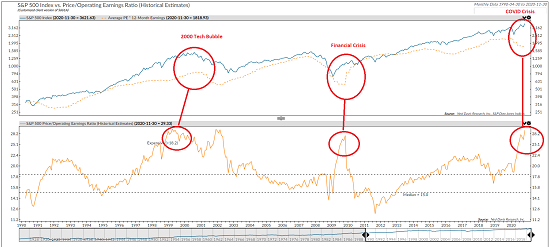
Source: Ned Davis Research
This chart, as well as almost all valuation charts like it, show that current valuations are at extreme levels at the present time. The bears argue that stocks are now "priced for perfection" and that any misstep along the way will end in disaster. Yikes.
To be sure, I can't argue with the fact that current P/E's are at levels seen prior to the tech bubble bursting in 2000 and around the Great Financial Crisis (GFC). Kinda scary, right?
However, I believe there is an important distinction to be made here. Look closely at the dates and the P/E on the lower clip. While the P/E was at extreme levels prior to the Tech Bubble bursting, note that this was not the case in 2008 and at the beginning of 2020.
During the GFC and the COVID pandemic, the P/E actually spiked AFTER the bear market in stocks occurred. This is a result of (a) the "E" (earnings) plunging as a result of the accompanying recessions and (b) the "P" (price) rising as traders priced in expectations of better days ahead - which was in response to, yep, you guessed it; economic and monetary stimulus.
Take a look at what happened to the P/E from mid-2009 through 2011. It fell. A lot.
This was in response to the economy recovering - thanks in no small part to the Fed's unprecedented creativity and additional economic stimulus (remember "cash for clunkers" etc?).
My take is that we're currently seeing a repeat of what happened after the GFC. Earnings tanked due to the lockdown but EPS expectations are now starting to move back up as the economy recovers. Again, thanks in no small part to the commitment of Jay Powell's bunch to do just about whatever it takes to keep the economy from a downward spiral.
So... While the valuation charts are definitely a little scary right now (okay, a lot scary), I think we need to remember that stocks are in the process of discounting the recovery in the economy and earnings. And as long as the recovery occurs, then it can be argued that stocks can continue to advance at a reasonable rate.
But... If the recovery is disrupted, delayed, or worse, well, the bears will argue that stocks are "ahead of their skis" and some downside adjustments may be necessary.
In closing, I'll argue that as long as the economy continues to recover, P/E's aren't a problem. So, here's hoping that the vaccines are effective, can be distributed quickly, and the economy can return to some sort of "normal" in the next 6-9 months. Fingers crossed.
Now let's turn to the state of my favorite big-picture market models...
The Big-Picture Market Models
There are no changes to report on the Primary Cycle board again this week. As I've been saying, the message from the board is the bulls remain in control. However, it should be noted that from a short-term perspective, stocks remain in an overbought condition and sentiment is overly optimistic. As such, a countertrend move at some point in the future wouldn't be surprising.
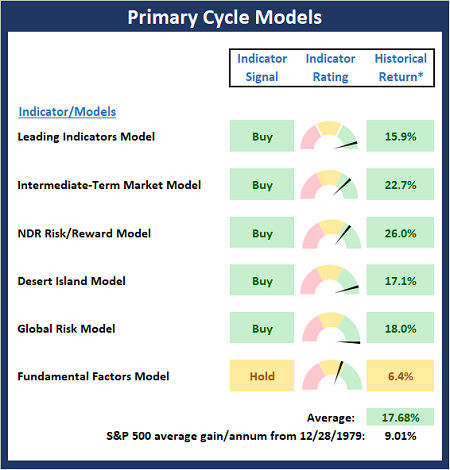
* Source: Ned Davis Research (NDR) as of the date of publication. Historical returns are hypothetical average annual performances calculated by NDR.
Reviewing "Primary" Cycle History
While I don't often make portfolio adjustments based on the long-term trends in the stock market (aka the "primary cycles"), I have found over the years that checking in on state of the cycles and the weekly/monthly charts helps to keep the big-picture in perspective.
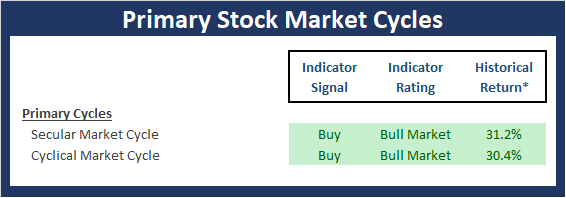
* Source: Ned Davis Research (NDR) as of the date of publication. Historical returns are hypothetical average annual performances calculated by NDR.
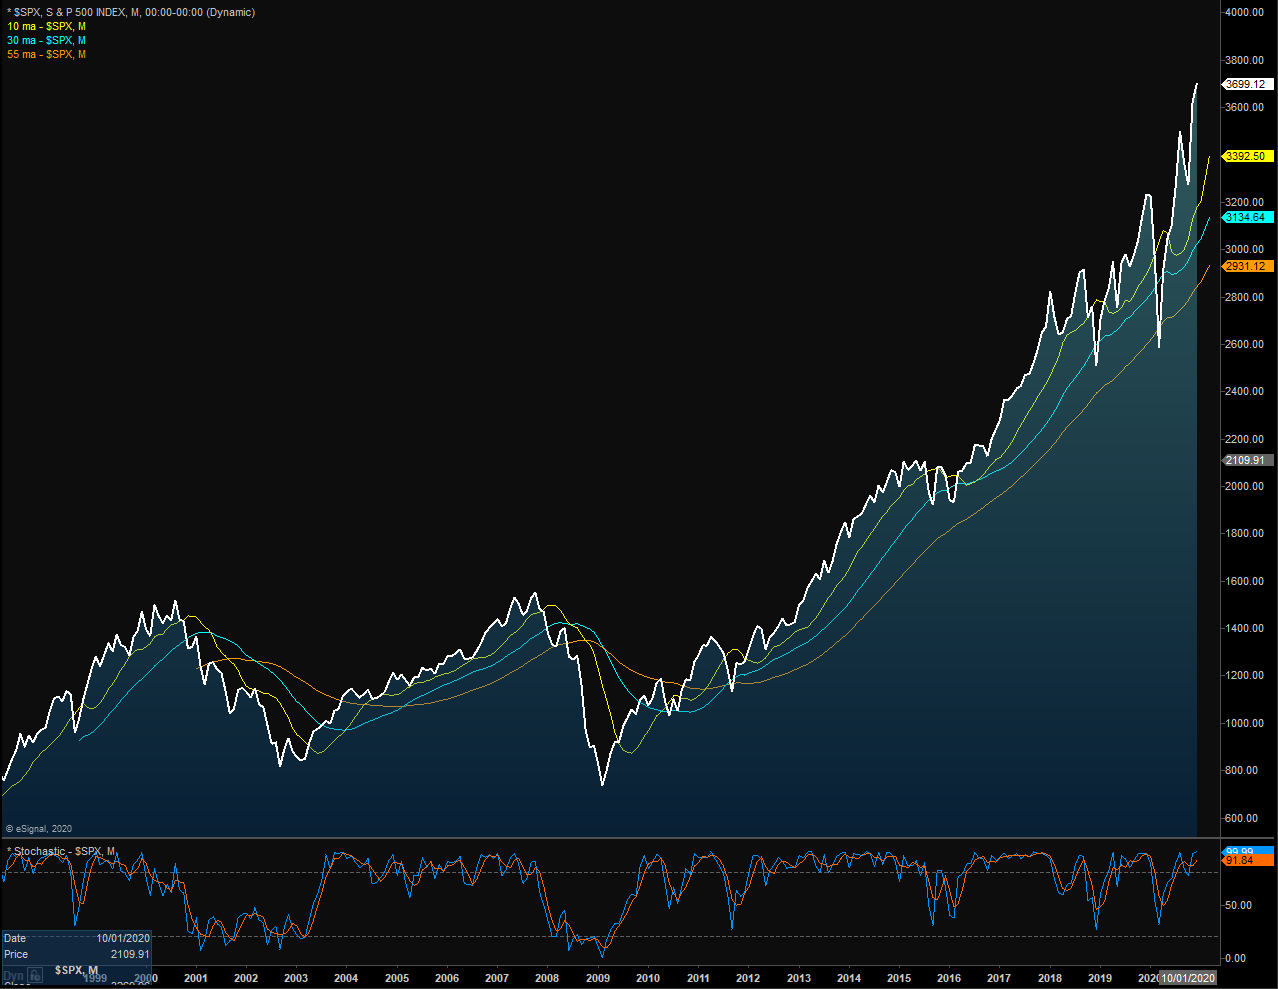
The Secular Market Cycle
Definition: A secular bull market is a period in which stock prices rise at an above-average rate for an extended period (think 5 years or longer) and suffer only relatively short intervening declines. A secular bear market is an extended period of flat or declining stock prices. Secular bull or bear markets typically consist of multiple cyclical bull and bear markets. Below is a monthly chart of the S&P 500 Index illustrating the current cycle, which we estimate began on March 9, 2009.
S&P 500 - Monthly
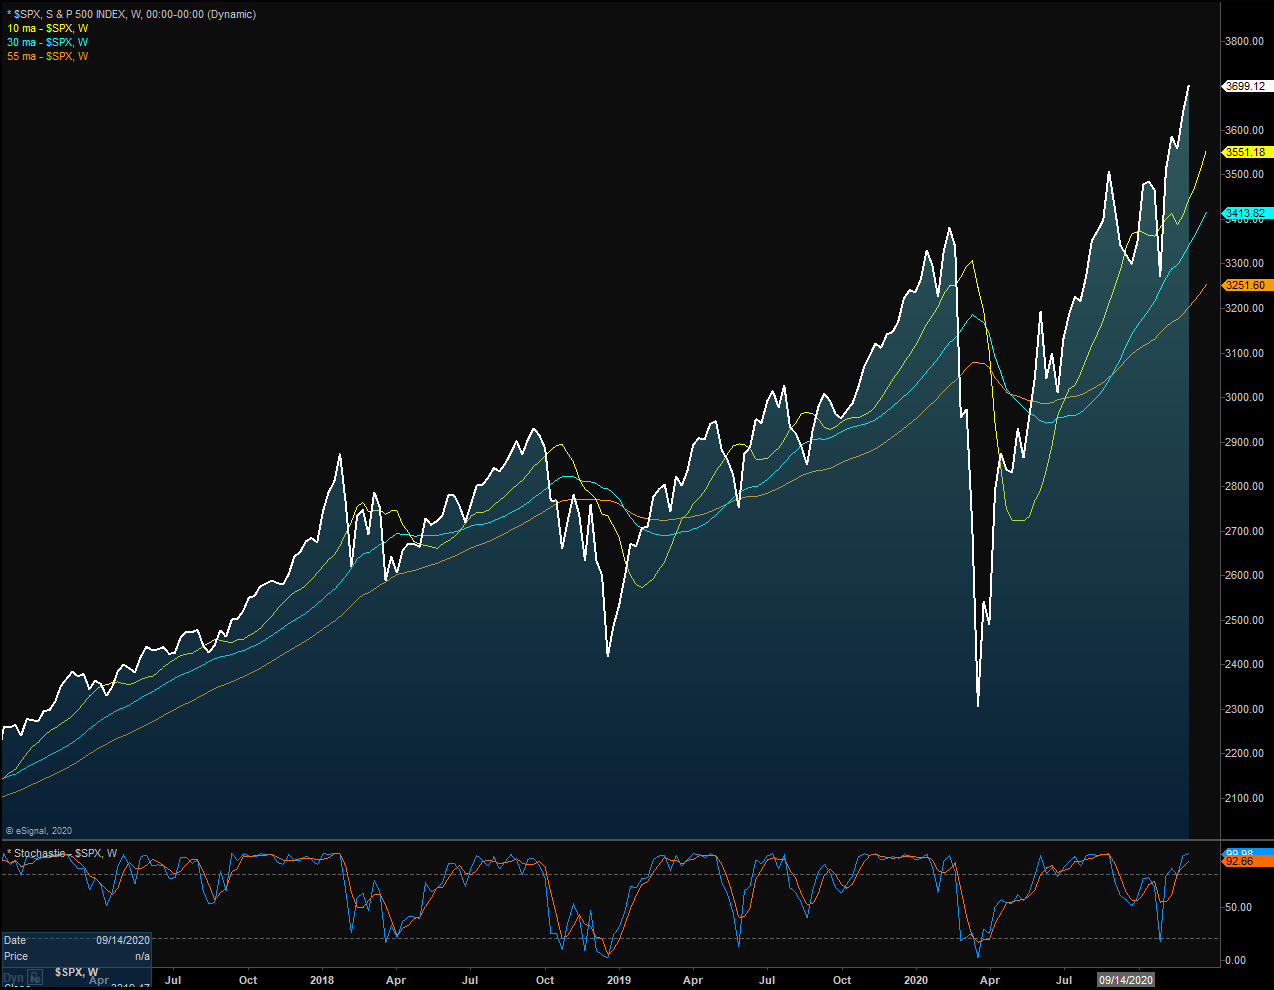
The Cyclical Market Cycle
Definition: A cyclical bull market requires a 30% rise in the DJIA after 50 calendar days or a 13% rise after 155 calendar days. Reversals of 30% in the Value Line Geometric Index since 1965 also qualify. A cyclical bear market requires a 30% drop in the DJIA after 50 calendar days or a 13% decline after 145 calendar days. Reversals of 30% in the Value Line Geometric Index also qualify. Below is a weekly chart of the S&P 500 illustrating the current cycle, which we estimate began on March 24, 2020.
S&P 500 - Weekly
(Click on image to enlarge)
The opinions and forecasts expressed herein are those of Mr. David Moenning and may not actually come to pass. Mr. Moenning's opinions and viewpoints regarding the future of the markets should ...
more

