
Apple, Amazon, AMC Entertainment Stocks Confirm This Bullish Trend: What To Watch For

Amazon.com Inc (AMZN), AMC Entertainment Holdings, Inc (AMC), and Apple, Inc (AAPL) are all trading higher in confirmed uptrends. An uptrend occurs when a stock consistently makes a series of higher highs and higher lows on the chart.
The higher highs indicate the bulls are in control, while the intermittent higher lows indicate consolidation periods. Traders can use moving averages to help identify an uptrend, with rising lower frame moving averages (such as the eight-day or 21-day exponential moving averages) indicating the stock is in a steep shorter-term uptrend and rising longer-term moving averages (such as the 200-day simple moving average) indicating a long-term uptrend.
A stock often signals when the higher high is in by printing a reversal candlestick such as a doji, bearish engulfing, or hanging man candlestick. Likewise, the higher low could be signaled when a doji, morning star, or hammer candlestick is printed. Moreover, the higher highs and higher lows often take place at resistance and support levels.
In an uptrend, the "trend is your friend" until it’s not. In an uptrend, there are ways for both bullish and bearish traders to participate in the stock. Bullish traders who are already holding a position in a stock can feel confident the uptrend will continue unless the stock makes a lower low. Traders looking to take a position in a stock trading in an uptrend can enter, usually finding the safest entry on the higher low.
Bearish traders can enter the trade on the higher high and exit on the pullback. These traders can also enter when the uptrend breaks and the stock makes a lower low, indicating a reversal into a downtrend may be in the cards.
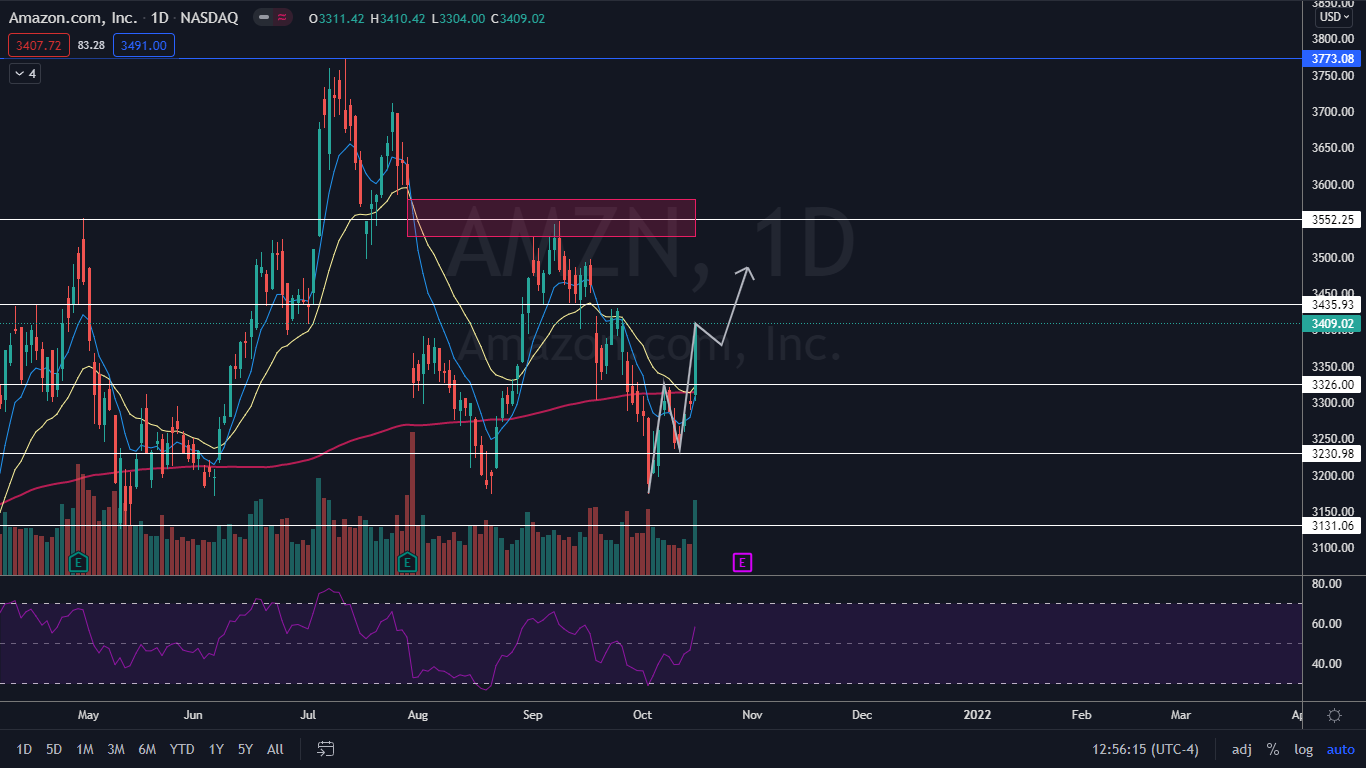
The Amazon Chart
Amazon hit a low of $3176.25 on Oct. 4 and bounced up to the $3326 mark over the following three trading days. The stock then retraced 2.85% lower and put in a higher low at $3231, which confirmed the uptrend. On Friday, Amazon printed another higher high above the Oct. 7 high.
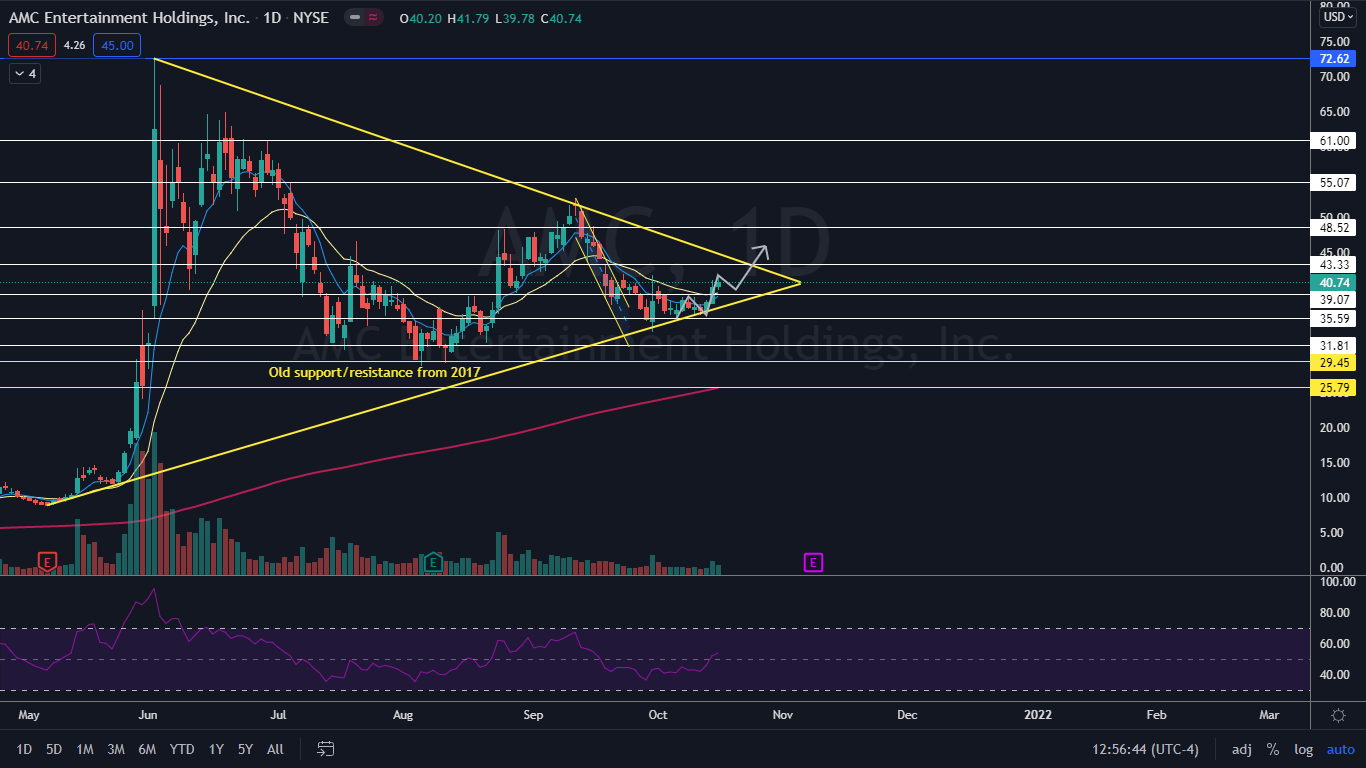
The AMC Chart
AMC is trading in a large pennant on the daily chart, with the lower ascending trendline of the pattern currently guiding the stock higher. AMC's uptrend began on Oct. 6 at the $35.59 level.
The stock then put in a higher low on Oct. 13 and bounced up about 15% higher over the three trading days that followed. It closed the trading day on Friday with a higher high at the $40.74 mark.
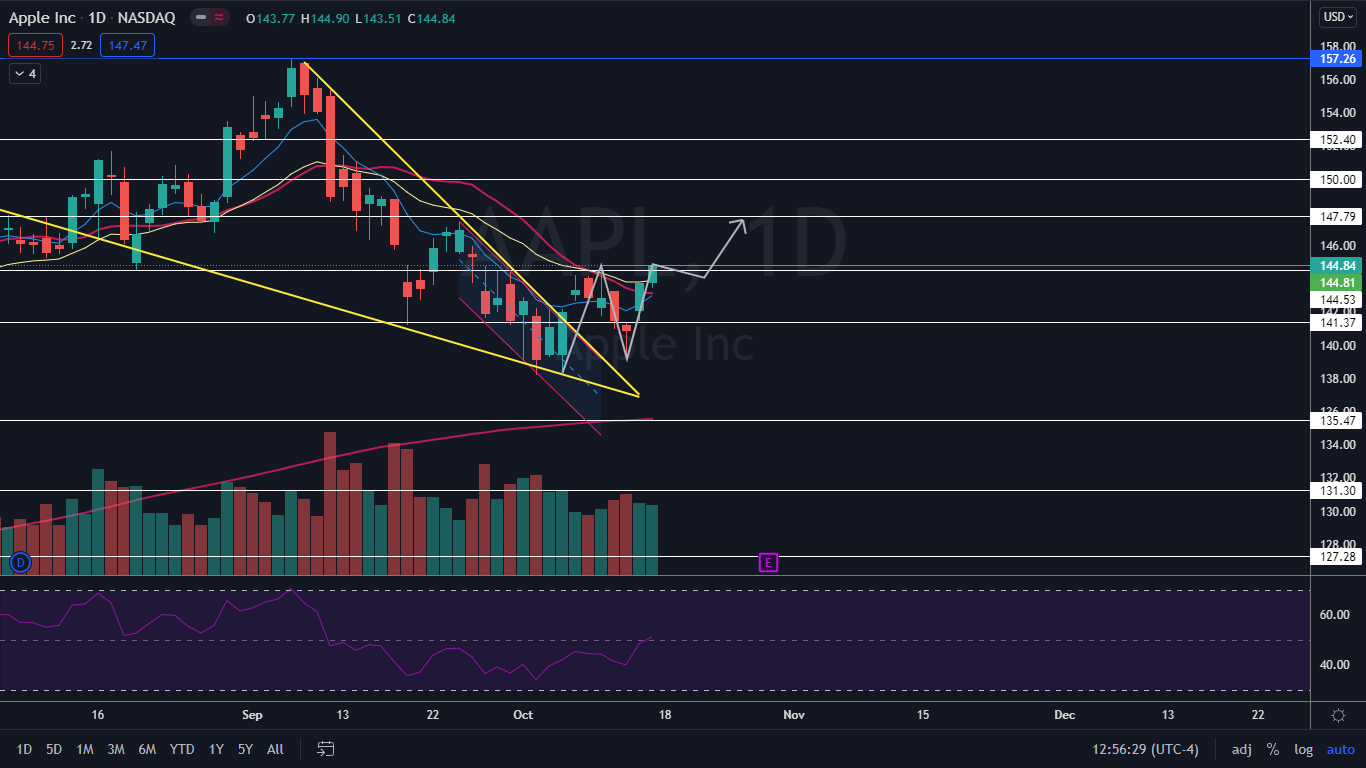
The Apple Chart
Apple hit an Oct. 6 low of about $138 and bounced up about 4% higher, which caused the stock to break up bullishly from a falling wedge on the daily chart. On Oct. 13, Apple printed a higher low at the $139 level and it bounced up another 4% higher over the following three trading days.
On Friday, the stock printed a slightly higher high above the Oct. 13 high. Traders will want to watch for bullish follow through to avoid seeing Apple create a bearish double top pattern near the $144 level.
Disclosure: © 2021 Benzinga.com. Benzinga does not provide investment advice. All rights reserved.


