
Aon - Chart Of The Day
Summary
- 100% technical buy signals.
- 18 new highs and up 10.25% in the last month.
- 36.59% gain in the last year.
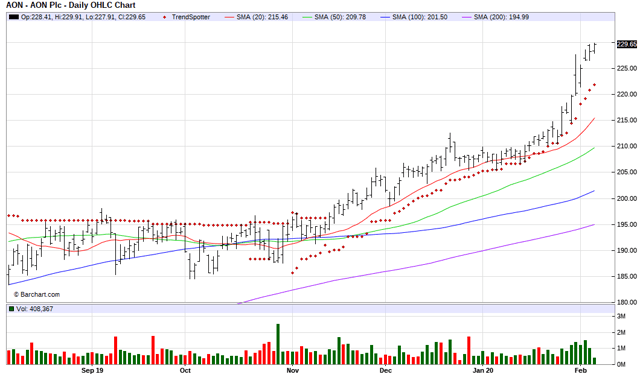
The Barchart Chart of the Day belongs to the Risk management services company Aon (AON). I found the stock by sorting Barchart New All-Time High list first by the most frequent number of new highs in the last month, then used the Flipchart feature to review the charts for consistent price appreciation. Since the Trend Spotter signaled a buy in 11/13 the stock gained 16.87%.
Aon PLC provides risk management services, insurance, and reinsurance brokerage and human resource consulting and outsourcing. The company's risk management services segment offers solutions for property liability, general liability, professional liability, directors' and officers' liability, workers' compensation and various healthcare products along with others. Its insurance and reinsurance brokerage segment offers property and casualty reinsurance and specialty lines, which includes medical malpractice, accident, life, and health, as well as capital management transaction and advisory services. Its human resource consulting and outsourcing segment offers human capital services in the areas of health and benefits, retirement, compensation, and strategic human capital. Aon PLC, formally known as Aon Corporation, is headquartered in London, the United Kingdom.
(Click on image to enlarge)
Barchart's Opinion Trading systems are listed below. Please note that the Barchart Opinion indicators are updated live during the session every 10 minutes and can, therefore, change during the day as the market fluctuates. The indicator numbers shown below, therefore, may not match what you see live on the Barchart.com website when you read this report.
Barchart technical indicators:
- 100% technical buy signals
- 40.20+ Weighted Alpha
- 36.59% gain in the last year
- Trend Spotter buy signals
- Above its 20, 50 and 100 day moving averages
- 18 new highs and up 10.2% in the last month
- Relative Strength Index 85.70%
- Technical support level at 226.70
- Recently traded at 229.84 with a 50 day moving average of 209.78
Fundamental factors:
- Market Cap $ 52.98 billion
- P/E 24.74
- Dividend yield .7%
- Revenue expected to grow 5.80% this year and another 5.90% next year
- Earnings estimated to increase 13.40% this year, an additional 11.80% next year and continue to compound at an annual rate of 12.17% for the next 5 years
- 15 Wall Street analysts issued 5 strong buy, 9 hold and 1 sell recommendation on the stock
- The individual investors following the stock on Motley Fool voted 136 to 21 that the stock will beat the market
- 7,712 investors are monitoring the stock on Seeking Alpha
Disclosure: None.


