
Amidst Last Week’s Bloodbath, Bulls Defend Crucial Support On Major US Equity Indices Friday
Last week, all major US equity indices lost north of 10 percent and were down a lot more at session lows Friday. If there is any consolation in this, amidst the carnage, bulls stepped up to defend important support. Some metrics are near washout levels.
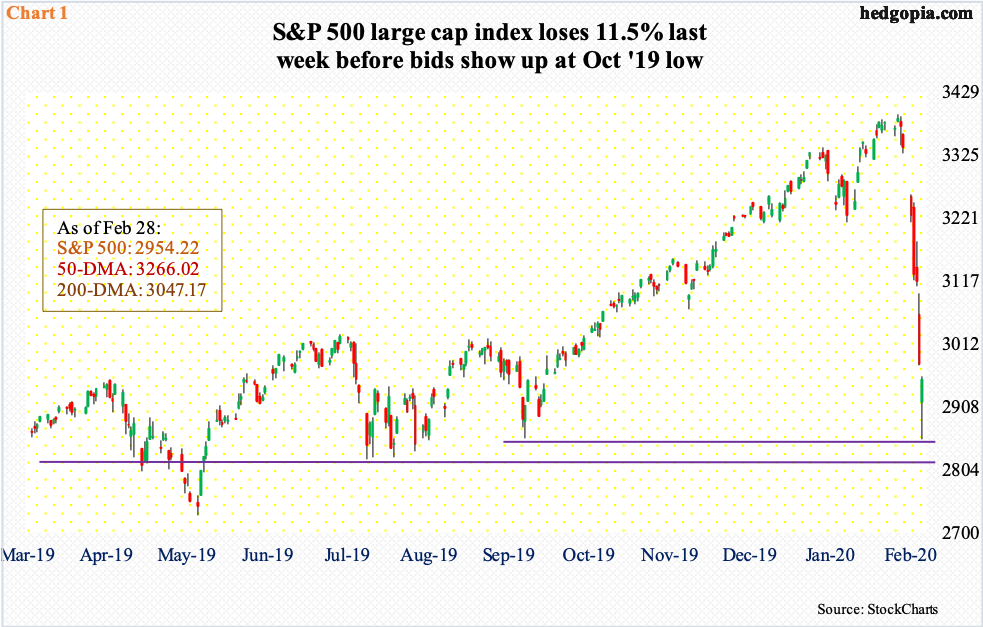
Last week was a vivid example of what happens when things get too lopsided. From late December 2018 through the all-time high of 3393.52 on February 19, the S&P 500 large cap index jumped north of 42 percent. That is in 14 months! Most recently, since early October last year, the index rallied nearly 17 percent!
The pace was clearly unsustainable, but sellers were on strike and dips were getting bought – until last week. In the end, the S&P 500 (SPX) lost in seven sessions what it took five months to build. Friday’s intraday low of 2855.84 essentially matched 2855.94 from October 3 last year (Chart 1). On the way to completing a round trip, the index hurriedly lost both the 50- and 200-day moving averages.
If there is any consolation for bulls, it is that bids showed up at the October low. In fact, 2800-plus has proven to be an important price point going back to January 2018. Thus far, it has held. By the close, the S&P 500 rallied nearly 100 points off Friday’s intraday low, with a potentially bullish hammer reversal.
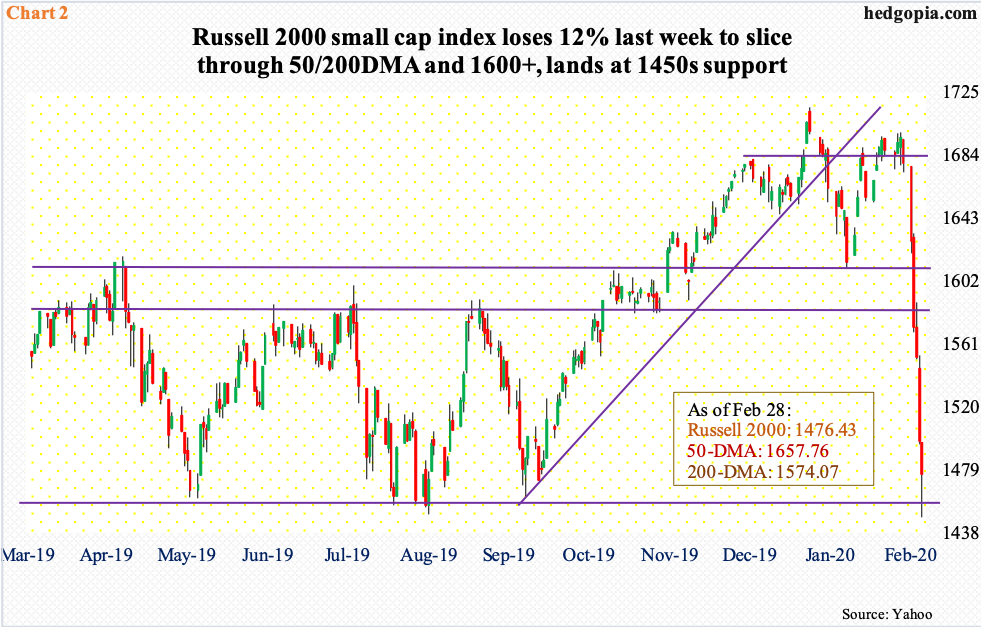
This is also true with the Russell 2000 small cap index.
First of all, small-caps have lagged large-caps for a while now. Longs are essentially hiding in the big names. A ratio between the Russell 2000 (IWM) and the S&P 500 peaked in June 2018, just before the former peaked, which occurred in August that year at 1742.09. The closest the Russell 2000 came in testing that high was on January 17 when it tagged 1715.08 (Chart 2). On the way to that high, the index broke out of 1600-plus, which worked as support/resistance going back to January 2018. In last week’s bloodbath, bulls again lost that level.
The good thing – if it can be called that – is that bulls showed up at crucial support. Several times last year, including early October, the Russell 2000 bottomed in 1450s. Friday, it dropped to 1448.21 intraday before closing at 1476.43. The index, however, did slice through both the 50- and 200-day.
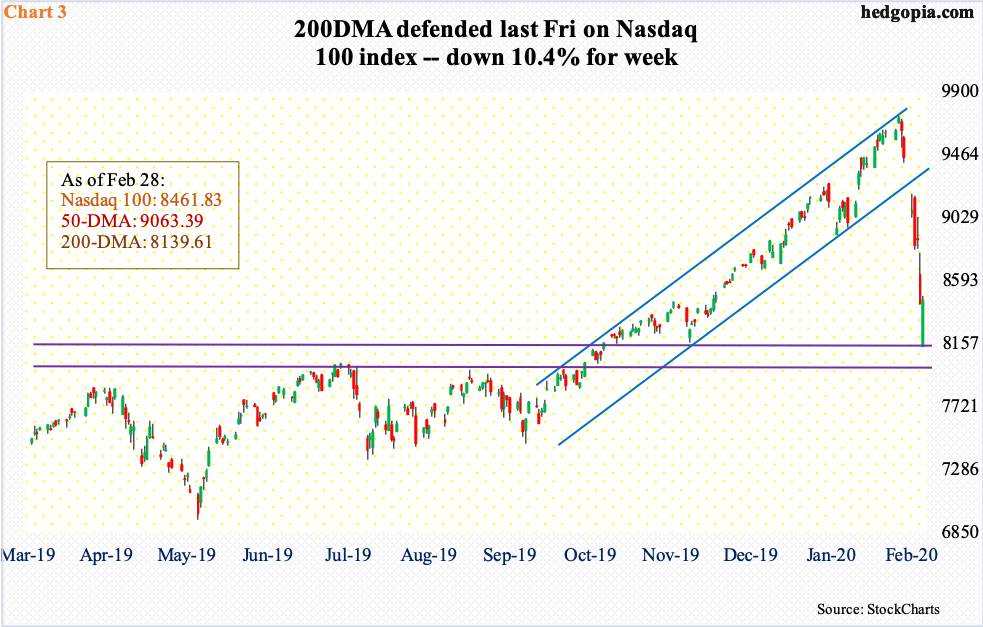
On the Nasdaq 100 index (COMP), the 50-day was lost but the 200-day was defended last week. Before this, tech momentum was so strong the index even managed to eke out a gain in January, even as peers such as the S&P 500 and the Dow Industrials were slightly down in that month.
From December 2018 through its all-time high of 9736.57 on February 19, the Nasdaq 100 jumped just north of 65 percent (no typo) and over 30 percent from early October last year! For nearly five months, it traded within an ascending channel (Chart 3). The record high set eight sessions ago kissed the upper bound and retreated – not a big deal as it was still within the channel. Come Monday, the index fell out of it, followed by continued selling in the next four sessions – until Friday when there were bids ready at the 200-day. At its worst, the index was down 3.6 percent but clawed its way back to end the session up 0.3 percent. There is also horizontal support at 8000-8100.
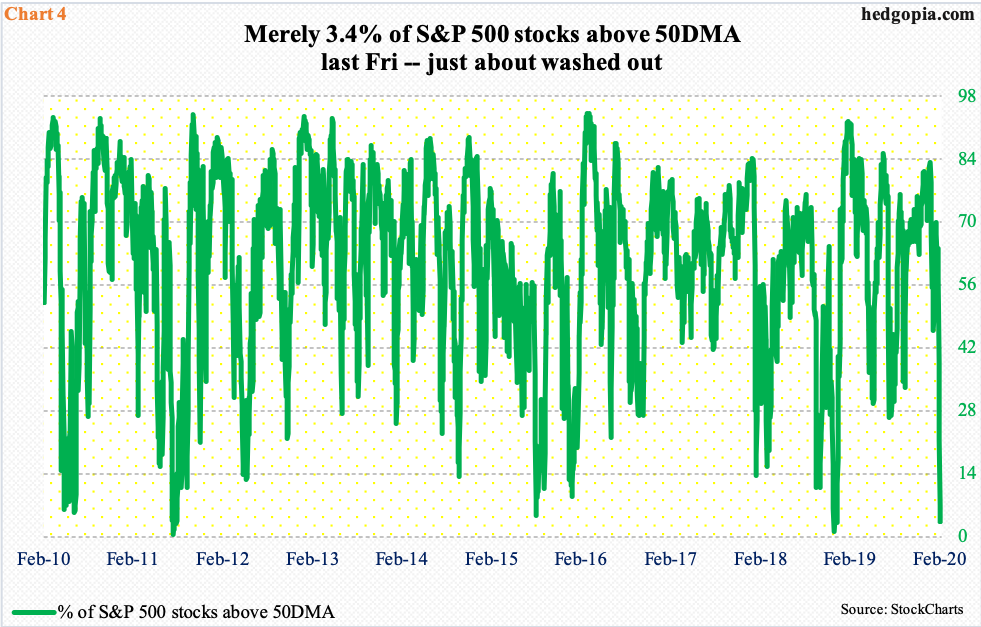
Bulls’ defense of the 200-day came as only nine percent of Nasdaq 100 stocks are above their 50-day. In December 2018, this dropped to three percent before going the other way.
Over on the S&P 500, by the end of last week, 3.4 percent of its constituent stocks were above their 50-day, versus 1.2 percent in December 2018 (Chart 4). Toward the middle of January when this metric was in low 80s, there was euphoria in the air. Now, the pendulum has swung the other way.
That said, Friday saw 938 52-week new lows on the NYSE (NYA) and 732 on the Nasdaq (Composite). This is high, but not high enough if we compare how things were at/near the lows of December 2018. Back then, they peaked at just under 1300 and over 1100, respectively.
It is entirely possible a new round of Covid-19 panic sets in, drawing in more sellers, before a tradable bottom is reached. In this scenario, Friday’s lows get tested and bids show up again. Or, the lows are breached, sending several metrics into washout territory, then followed by a reversal higher.
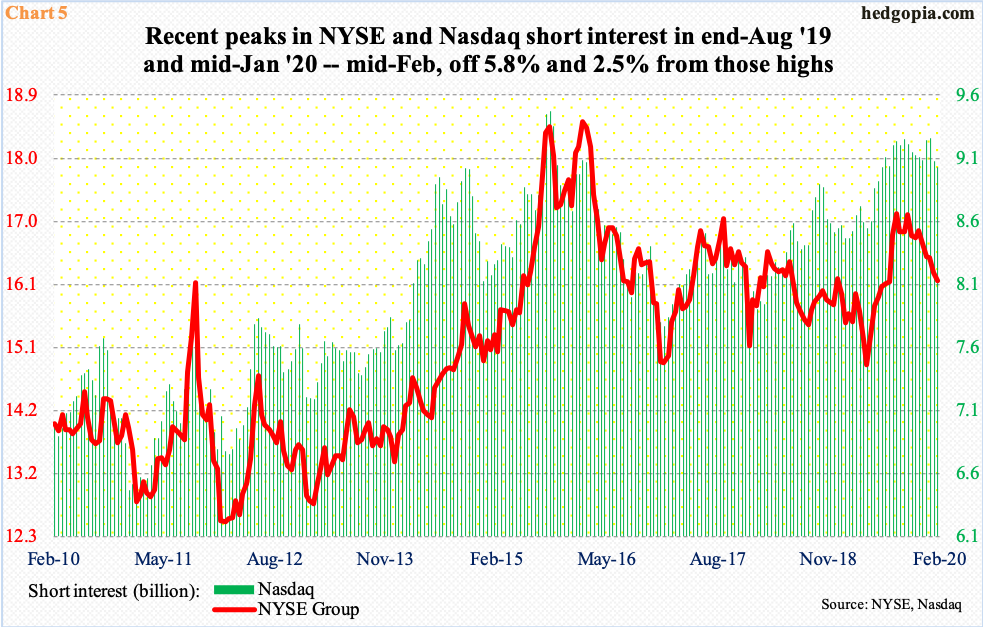
Ironically, shorts potentially could be lending longs a helping hand. The former made a killing last week; major equity indices all dropped north of 10 percent. Leading up to this, short interest was elevated, particularly on the Nasdaq, where it totaled nine billion shares as of mid-February. This was down 2.5 percent from the mid-January high of 9.3 billion, which was the highest since October 2015. On the NYSE, the most recent high was recorded at the end of August last year at 17.1 billion, which was the highest since March 2016; mid-February was 16.1 billion.
It is possible shorts played a role in the intraday reversal Friday on the Nasdaq 100. If bulls continue to defend support on the aforementioned three indices, many shorts likely will find it prudent to lock in gains and cover – for now.
This is even more so particularly if the Fed, and other major central banks, begin signaling in earnest that they are getting ready to act. The FOMC meets on 17-18 this month. In the futures market, a 25-basis-point cut is priced in, with a sizable number even betting for a 50-basis-point cut. After this, markets expect two more cuts this year. This is aggressive, considering that the fed funds rate is already at a range of 150 to 175 basis points. On the long end, the 10-year Treasury yield dropped to a fresh low of 1.3 percent last week. More often than not, markets lead the Fed.
Jerome Powell, Fed chair, Friday said the bank is ready to cut as the coronavirus “poses evolving risks” to the US economy. Early this morning, the Bank of Japan said it will strive to “provide ample liquidity and ensure stability in financial markets” through appropriate market operations and asset purchases.
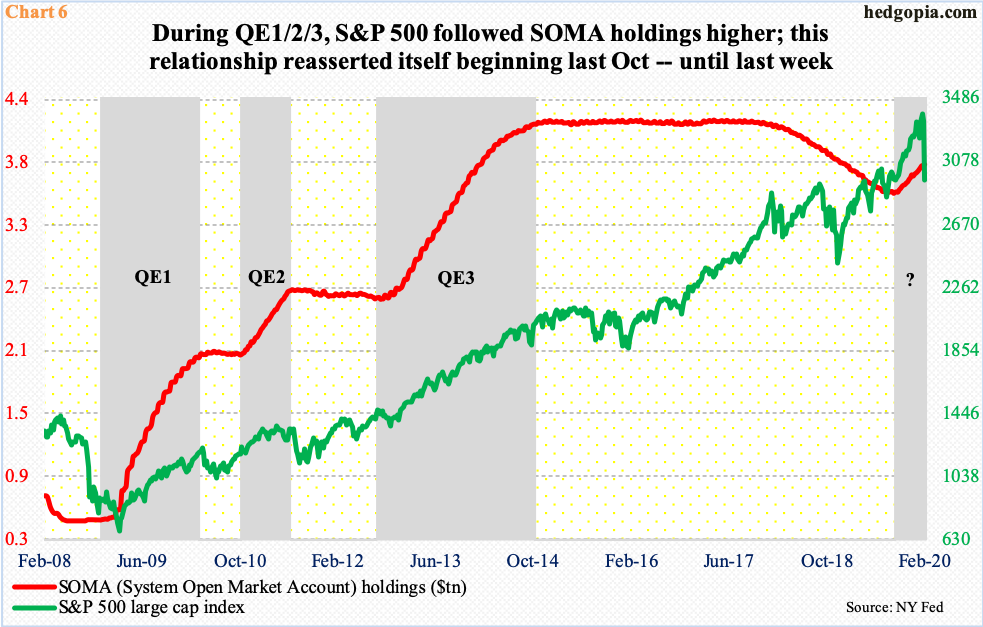
In the past, stocks have reacted positively to such central bank reaction. The three iterations of quantitative easing during and after the financial crisis serve as an example. As a matter of fact, last October’s lows in US stocks coincided with a bottom in SOMA (System Open Market Account) holdings, which rose from $3.55 trillion late September to last week’s $3.82 trillion (Chart 6). Stocks followed higher – until last week’s reversal.
The question is, is it different this time? The fact remains that monetary policy may be better equipped to deal with a liquidity-induced crisis but maybe not something such as Covid-19. Will people go to the movies after a rate cut? This is an evolving demand shock. Or, will it solve the ongoing supply shock?
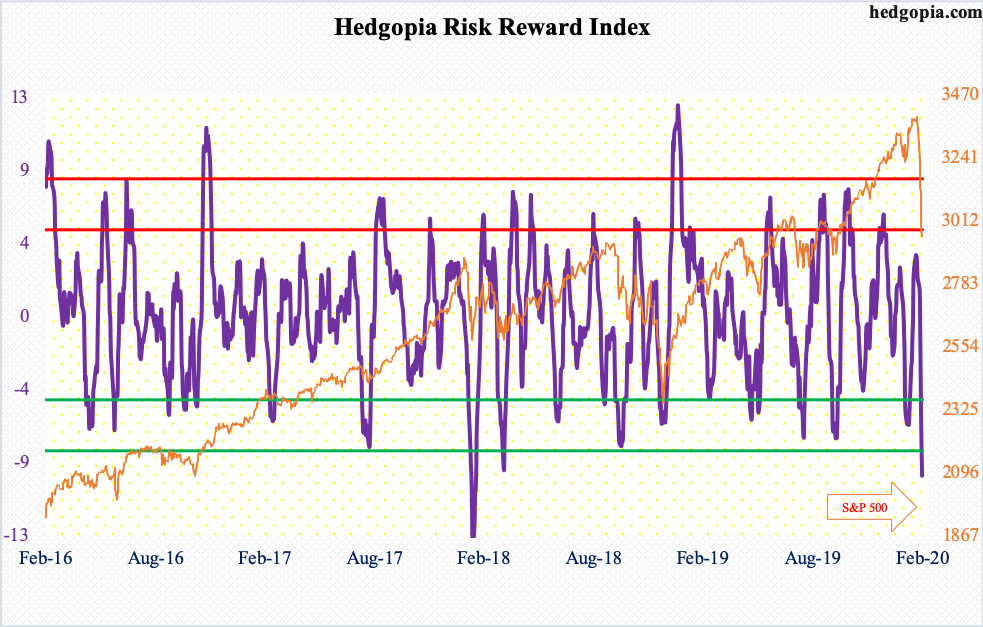
Hence the significance of watching stocks’ reaction function. Because, as explained earlier, major US indices are at/near crucial support and because several metrics are severely oversold, the path of least resistance is up. Our own Hedgopia Risk Reward Index has dropped well into the green zone (chart here). The bigger question is, will this trading opportunity be used as an opportunity to bail out? Central banks cannot afford that.


