
A Stock-Picker's Guide To Benjamin Graham's Screening Rules
This article is the first in a series about screens designed by famous investors. For an overview of the subject, see my previous article, Can Screening for Stocks Still Generate Alpha?
Benjamin Graham, who has often been called the father of value investing, published The Intelligent Investor in 1949 and revised it several times, most recently in 1972. In that last and fourth edition, published in 1973, he included three different sets of guidelines, which could be called “checklists” or “screens.” The first was for the “defensive investor,” and it’s the most famous. The second was a rule for investing in “Net-Current-Asset (or ‘Bargain’) Issues.” And the third was for the “enterprising investor.”
I’m going to take a close look at all three screens, re-creating them in Portfolio123; in addition, I’ll be offering some modifications to the first of those screens to bring it more up-to-date.
Part One: Stock Selection for the Defensive Investor
Graham lists seven selection criteria for the defensive investor. I’ve tried to duplicate them for today’s stocks (you can see my screening rules here). They are:
- Adequate Size of the Enterprise. Graham’s limit is $100 million in annual sales for most stocks and $50 million in assets for utilities. Now these are 1972 numbers. To get the current equivalent, I used a time series of the nominal GNP. So for right now, you’d need a minimum of $1.76 billion in sales or, for utilities, a minimum of $880 million in assets. Twenty years ago you’d need a minimum of $835 million in sales. Graham did not specify a minimum price per share, and if you were using his screen back in 2002, you’d have considered buying shares in Enron after they’d fallen to $0.35. I think setting a minimum per-share price of $1 makes sense here.
- A Sufficiently Strong Financial Condition. Graham specifies that current assets should be at least twice current liabilities, and long-term debt should not exceed net current assets (working capital). He makes an exception for utilities, saying they do not have to meet the first criteria, and for the second that their total debt should not exceed twice their book value (whenever Graham talks about book value, he means tangible book value). Unfortunately, these conditions do not apply to companies in the financial sector, which usually do not report current assets or current liabilities in their financial statements. Graham by no means thought that investors should exclude these companies: he is quite explicit on that score. Instead, he says, quite vaguely, that “The question of financial soundness is, therefore, more relevant here than in the case of the typical manufacturing or commercial enterprise.” So it’s up to each investor to make his or her own rules about this. For the purposes of this screen, I decided that companies in the financial sector should be in the top 20% of their respective industries in terms of their tangible common equity ratio and solvency ratio.
- Earnings Stability. Graham requires some positive earnings for each of the past ten years.
- Dividend Record. Graham requires uninterrupted dividend payments for each of the past twenty years.
- Earnings Growth. Graham specifies that the average earnings over the last three years should be 1/3 greater than the same number ten years ago.
- Moderate Price-to-Earnings Ratio. Again using the average earnings over the last three years, Graham specifies a maximum P/E of 15.
- Moderate Ratio of Price to Assets. Ideally, the ratio of price to tangible book value should be 1.5 or lower, but Graham allows this to be higher for stocks with very low P/E by applying the following rule: the stock’s P/E and P/B, when multiplied together, should be less than 22.5.
Not many stocks pass this screen. As of today (7/27/2020), only three non-ADRs pass: Credicorp (BAP), Cincinnati Financial (CINF), and Nucor (NUE). If you include ADRs (and Graham would likely have seen no good reason not to—he didn’t mention ADRs in his book, but there were plenty of them around when he was writing), the field expands considerably; but the data is, I’m afraid, less reliable.
How well does this screen perform?
Ideally, a follower of Graham would hold a stock for a minimum of a year, but likely considerably longer. So the best way to test this screen would be to look at what stocks pass every week, buy them, and hold each one for two years. We would then look at the average return of each stock, and compare that to the benchmark return. In this case that would be the return of the Dow Jones Industrials, which is what Graham himself used as a comparison in The Intelligent Investor.
If we had started this process twenty years ago, with a round-trip transaction cost of 0.25%, we would have averaged 34.42% per stock per two-year period, or 15.94% per stock per annum, compared to the DJI’s 19.94% per two-year period, or 9.51% per annum. That’s a significant advantage.
If we look at how the screen would have performed if we had started this process only ten years ago, the performance is not as remarkable: 21.89% per stock per two-year period, or 10.40% per annum, compared to the DJI’s 30.87% per two-year period, or 14.40% per annum. The DJIs would have been a better bet.
Many investors think this is a bad way to backtest a screen because it’s a per-stock measure and says nothing about how the screen would have performed year-to-year. There’s no information here about drawdowns, volatility, Sharpe ratios, or alpha. In addition, averages are misleading because outliers are likely to skew your results favorably, and averages don’t take into account compounding.
But the problem is that sometimes no stocks pass the screen, and sometimes over two dozen do. How do you compound that? In order to properly backtest, you need a portfolio management strategy, and Graham does not provide one. When you buy a stock, do you hold it for one year, two years, or longer? When do you sell? How many stocks should you own at a time? If I run the screen today, three stocks (excluding ADRs) pass; if I had run it in early 2016, twenty would have passed. How do you backtest that? If you’re a value investor, yes, you would invest a lot more in stocks when the market is low than when it’s high. But most of us don’t have that luxury—or that much cash sitting idle. And how do you measure your Sharpe ratio if you invest $20 million in one year and only $3 million in another?
Now Graham himself may not have stuck with this screen. He devotes considerable space in The Intelligent Investor to showing how the screen would narrow the number of stocks in the Dow Jones Industrials down to the really choice ones. This screen, however, would exclude all stocks in the DJI nowadays. Over the last twenty years, screening every week, not a single stock in the DJI would have passed.
I believe that Graham would have loosened certain rules to allow more stocks to pass. If you want to expand the screen, I suggest the following, which is based on a comparison of the DJI today and the DJI in 1972: current assets only have to be 25% more than current liabilities, total debt can be as high as three times working capital, the solvency ratios for financial stocks can be lowered to the top 40%, P/E can be 20, and price to tangible book value can be as great as 5. The size, ten years of earnings, twenty years of dividends, and earnings growth requirements can remain the same. If you run this screen on the DJI today, only one stock passes—Intel (INTC)—but over the last ten years an average of two DJI stocks pass each week. If you run the screen on the broader market, you’ll scoop up forty to fifty companies, which is a much broader selection.
As for the expanded screen’s performance, it’s not as good over the twenty-year period, but better over the last ten years. If you start the screen twenty years ago, the average company would gain 28.18% over a two-year period, or 13.22% annually; if you start ten years ago, the numbers are 25.05% and 11.82%.
Part Two: Net Current Asset Issues
Graham writes, “The idea here was to acquire as many issues as possible at a cost for each of less than their book value in terms of net-current-assets alone—i.e., giving no value to the plant account and other assets. Our purchases were made typically at two-thirds or less of such stripped-down asset value. In most years we carried a wide diversification here—at least 100 different issues.” (Note that Graham does not require that stocks be bought at two-thirds of this stripped-down asset value, but simply observes the typical price he paid.)
While in the other screens we’re discussing in this article, the idea is to pick and choose from the stocks the screen returns, here the idea is to buy the whole lot, willy-nilly. Once again, the time frame for investing should be around two years.
Like the previous screen, this screen runs into a problem if you include financial stocks, since they don’t report current assets. So for financial companies, I use the cash that they report holding. The formula for most stocks is simply current assets minus total liabilities is less than market cap, while for stocks in the financial sector, it’s cash minus total liabilities is less than market cap. And for this screen I’m going to lower my minimum price to $0.50 per share. Here’s a link to the screen.
Running this screen today brings up eighty or ninety companies, most of which are nanocaps. The largest non-ADRs that pass are Hollysys Automation Technologies (HOLI), PDL Biopharma (PDLI), and NextCure (NXTC).
This time, when measuring performance, I’m going to add 2% in round-trip transaction costs, because it’s not easy to buy and sell companies like these.
If we’d started this screen twenty years ago, the performance is quite strong: 32.36% per two-year period, or 15.05% per annum. But if we’d started only ten years ago, the performance is weak: 10.66% per two-year period, or 5.2% per annum.
On the other hand, our benchmark should be quite different. Rather than the Dow-Jones Industrial Average, we should compare our performance to holding all stocks in our universe for two years. That way we could tell if narrowing them down to “net-nets” is a good strategy or not.
If we had invested in every stock with a market cap of $30 million or more that sold for more than $0.50 per share over these periods, with no slippage costs, our average two-year return over the last twenty years would be 21.55%, or 10.25% annualized, and over the last ten 19.43%, or 9.29% annualized. In comparison to this, the net-net strategy has done well over the last twenty years but not terribly well over the last ten. However, it’s been a very tough environment for value stocks lately, and I would wager the strategy still has some legs.
I should add here that I measured the returns quite differently than I did for the first two screens (and the next one as well). For those screens I measured the average return per stock; here, I’m measuring the average return per portfolio.
If you measure the return per stock for the net current assets screen, the result is 58.66% per two-year period in the last twenty years (25.96% annualized) and 15.09% per two-year period in the last ten years (7.28% annualized). But this would require investing five times as much in these stocks during some years (2009) than during others (2018). The reason the return per stock for this portfolio may not be the right measure is that Graham invested in the whole basket at once. So if he had divided his portfolio among the 60-odd stocks that passed his screen in 2018, just like the 300-odd stocks that passed in 2009, his returns would not have been terribly good. If, on the other hand, he invested five times as much in 2009 as in 2018, he would have done very well on his investments in this group of stocks indeed, regardless of how his overall portfolio performed. Getting superior returns with a deep value strategy requires one to invest a lot more in down markets than in up ones.
Part Three: Stock Selection for the Enterprising Investor
Near the end of The Intelligent Investor, Graham proposes an interesting variation on his ideas for enterprising investors, who might venture into riskier territory than defensive investors—including much smaller stocks. Here are his ground rules.
- No size constraint. Graham sticks to the stocks in the Standard & Poor’s Stock Guide, which used to include just about every stock on the major exchanges and about half of the OTC stocks too. We’ll go ahead and add a price constraint too of $1 per share.
- Price less than 9 times TTM earnings.
- Current assets less than 1.5 times current liabilities.
- Debt less than 1.1 times working capital. (You can relax the solvency restrictions for financial companies and utilities too.)
- Five years of earnings.
- A current dividend payment.
- TTM EPS greater than it was four years ago.
- Price less than 1.2 times tangible book value.
You can find my version of this screen here.
In addition, Graham preferred stocks whose S&P rating was better than average. This rating was based on stability and growth of earnings and dividends over the last eight years. I’ve created a ranking system based on these four factors that can be used in conjunction with this screen; you can see it here.
This screen currently brings up close to forty stocks. The largest non-ADRs that pass right now are Essent (ESNT), Radian Group (RDN), and Cathay General Bancorp (CATY). It also brings up a good number of microcaps, for what it’s worth. These are really the deepest of deep-value stocks, and Graham is clear that selecting from this group should be done carefully.
I’ll test this once again using a two-year holding period, this time with round-trip transaction costs of 1%.
The average stock that passed this screen in the last twenty years would return 34.39% over a two-year period, or 15.93% annualized; in the last ten years, the return goes down to 18.89% over a two-year period, or 9.04% annualized.
Conclusion
I’ve summarized the results of all my backtests in the below table:
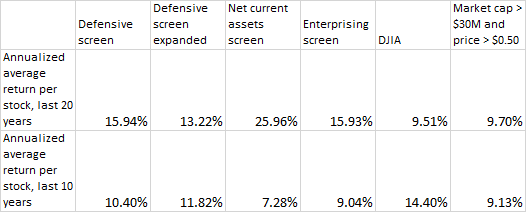
Personally, I wouldn’t invest in either the defensive or the enterprising screen. Graham’s emphasis on balance-sheet measures is quite different from mine. The debt-to-EBITDA ratio strikes me as a better measure of solvency than either the current ratio or the ratio of debt to working capital. For the same reason, I think the price-to-book ratio doesn’t make as much sense as other value measures: a company with negative book value can have excellent prospects if its earnings are sufficient to pay off its debt. Regarding the P/E ratio, I believe that one should compare a stock’s P/E to other stocks in the same industry or sector rather than assigning a necessarily arbitrary cutoff.
On the other hand, I do like Graham’s emphasis on steady earnings; his minimum growth thresholds seem sensible to me; his judgment of size according to sales is wise; and there’s something intuitively appealing about the net-current-assets approach.
But the final verdict has to be the numbers. There’s something to be said for a screen that can significantly outperform the market for a twenty-year period starting 28 years after it was last revised. And when all three screens that he designed do so, while picking very different stocks, that’s reason enough right there to admit that Graham was a genius.
My portfolio's CAGR since 1/1/2016: 35%.
My top ten holdings right now: SGC, ATEN, ORN, SMMT, DPMLF, TPRFF, KMDA, MGIC, MMMB, RMNI.


