A ‘Perfect Week,' The Most Expensive Market In History, And No Profits, No Fear
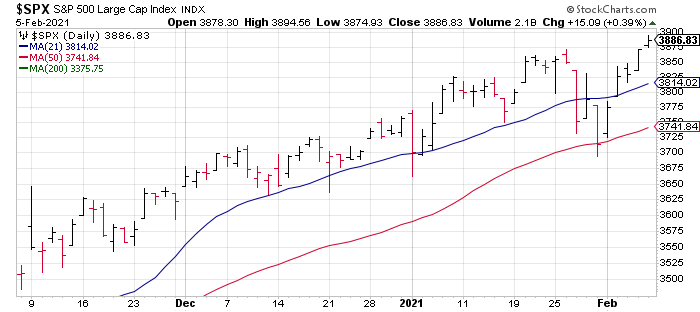
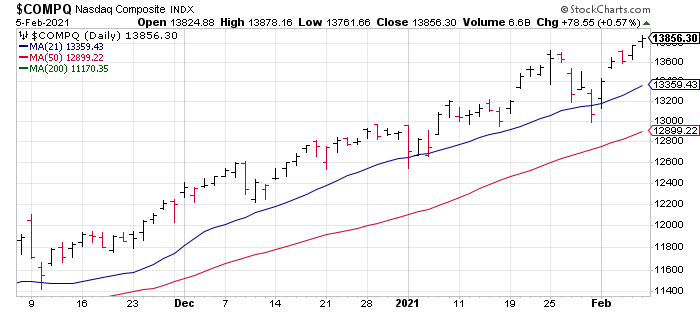
The S&P recorded a “perfect week” last week in which it was up all five days and closed the week at an ATH (the term comes from Bespoke Investment Group). The NASDAQ just missed by being down 0.02% on Wednesday. Here are the weekly returns for the major indexes: S&P: +4.66%, NASDAQ: +6.00%, and Russell: +7.67%.
While the market won’t stop going up, reasons for concern continue to multiply. For one, based on the Price to Sales ratio of the S&P, this is the most expensive market in history.
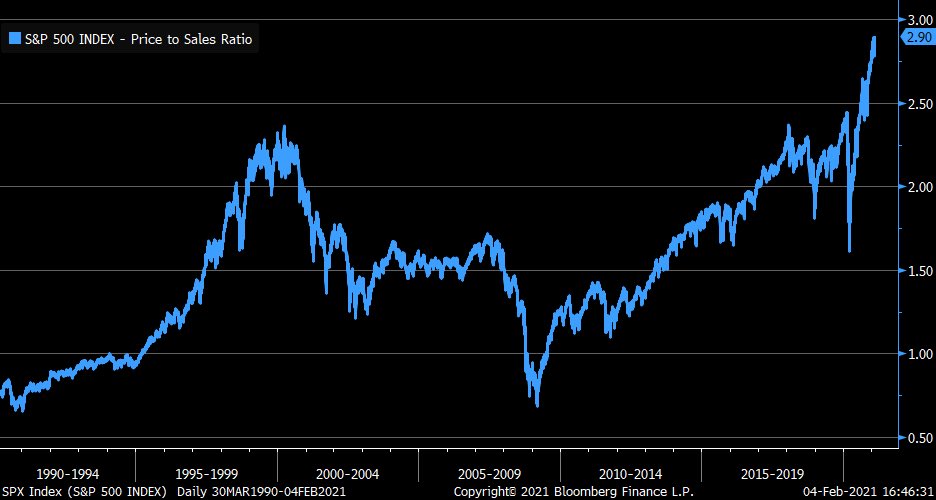
Chart Source: Liz Ann Sonders Twitter, Feb. 5, 4:09am PST
In addition, almost 35% of the companies in the soaring Russell 2000 have seen negative operating earnings over the last 12 months. No profits, no Problem.
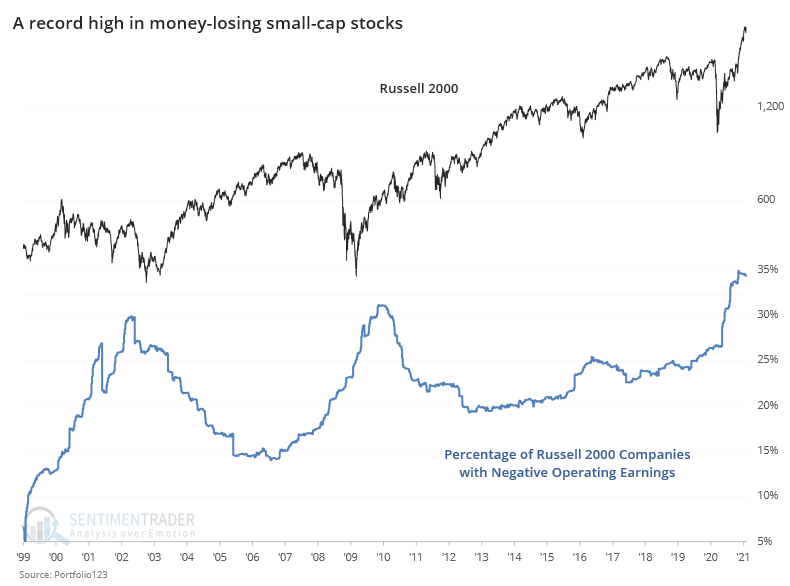
Chart Source: Sentimentrader, “Weekly Wrap For Feb 5 – More mania as internals decline”, Feb. 5
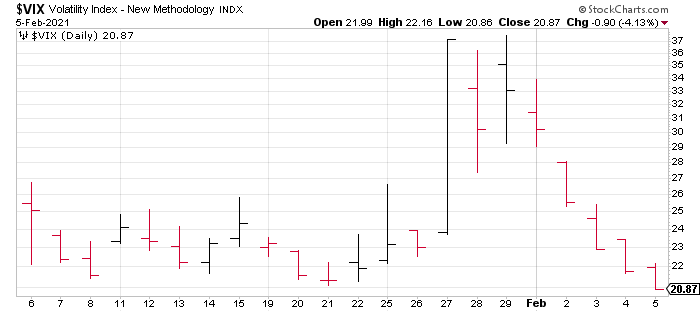
Further, the market has no fear with the VIX dropping 43.9% over the last seven trading sessions – the second most since 1990 according to Charlie Bilello.
Short sellers have given up pushing the median short interest percentage on stocks in the S&P, DJIA, NASDAQ-100, and Russell 2000 to a 17-year low just above 2%.
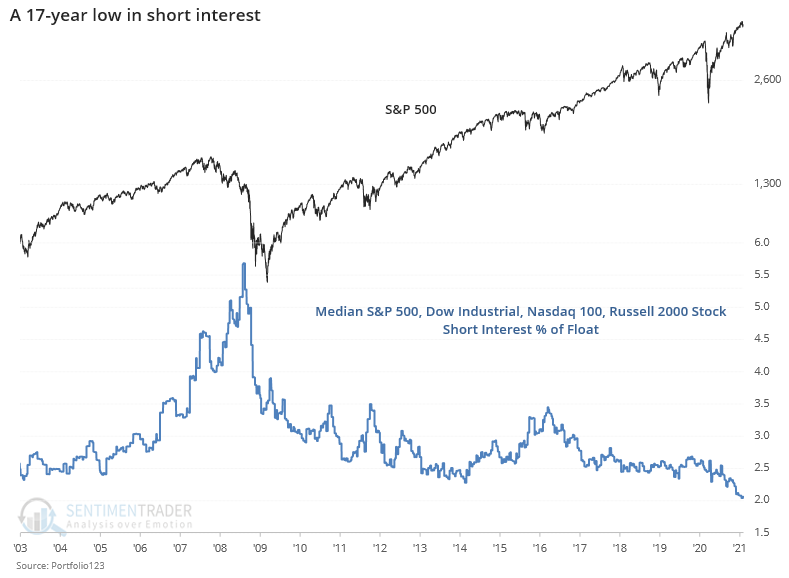
Chart Source: Sentimentrader, “Weekly Wrap Feb 5 – More mania as internals decline”, Feb. 5
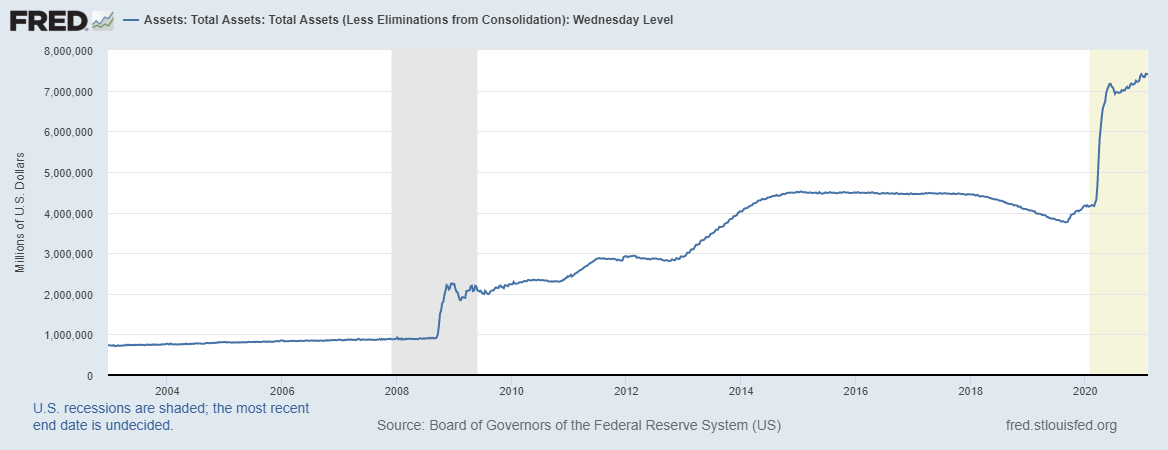
Taking the long view, the S&P has now risen from a bear market closing low of 677 on Mar. 9, 2009 to yesterday’s close of 3,887 – a 474% increase, or 15.8% annualized over the 11 years and 11 months. The whole thing has been driven primarily by The Fed’s new policy of Quantitative Easing, not real economic growth, and this has created the biggest bubble in economic history.