
A New Cluster Of Hindenburg Omens Betrays The Bullish Case For Stocks
I have written about the value of the Hindenburg Omen as a technical stock market signal several times over the past few years. To summarize, while an individual signal has very little value in forecasting a stock market crash, as some seem to suggest, a cluster of signals can be valuable in that it signals a pattern of dispersion that is not compatible with a healthy uptrend.
In the past, these clusters have marked important intermediate and long-term reversals. You’ll notice in the chart below that at both the 2000 and 2007 stock market peaks there were a significant number of omens triggered during both a 3-month and 12-month window. We saw something similar in mid-2015 before a pair of sharp corrections. We saw another rising pattern in early-2018 leading into the “volmageddon” selloff and again later that year just prior to the steep fourth-quarter decline in the broad stock market.
(Click on image to enlarge)
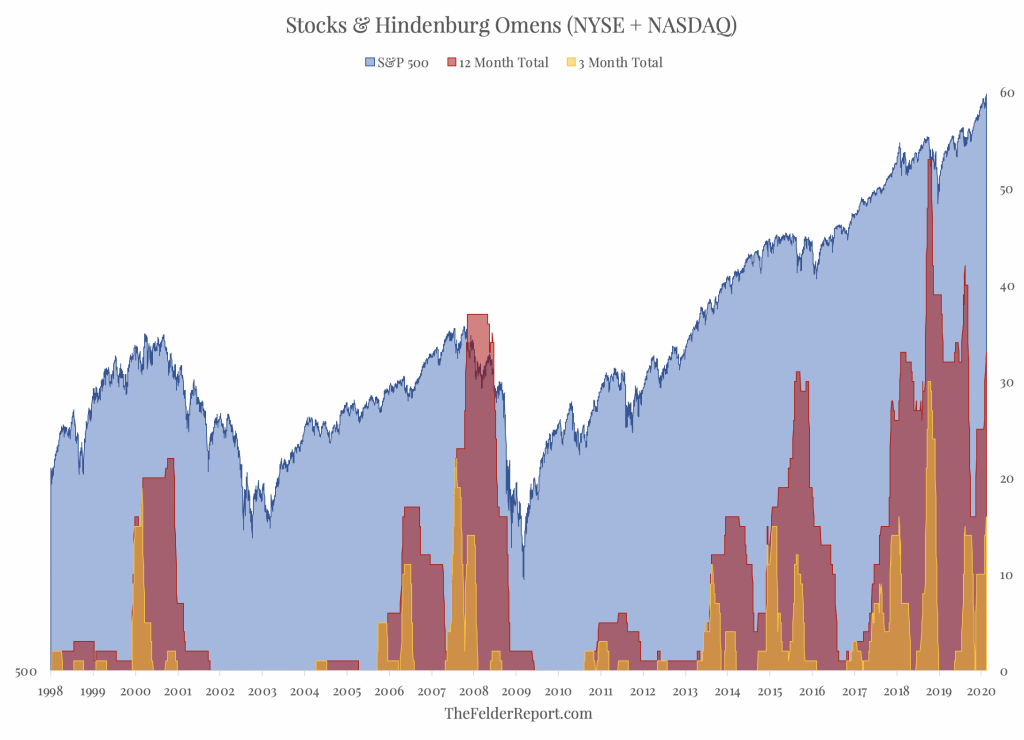
Over the past couple of weeks, we have seen another cluster of 8 individual signals between the NYSE and Nasdaq. This takes the 3-month total back up to 16 and the 12-month total back up to 33, levels which have proved significant over the past twenty years or so. Again, this doesn’t mean stocks are going to crash; it merely suggests the current uptrend for stocks is not as healthy as the bulls should hope. Furthermore, it does increase the probability of near-term reversal for the broad indexes.
Disclosure: Information in “The Felder Report” (TFR), including all the information on the Felder Report website, comes from independent sources believed reliable but accuracy is not ...
more

