
A Long Term View To Anticipate Market Peaks
“Davidson” submits:
It may seem too obvious to comment on this. Just the same, it bears repeating that markets peak with earnings and economic activity after the fact. The SP500 w/Earnings & Selected P/E Levels chart is from Dec 1939-Present. The vertical hash-lines will help to see how regularly peak in eps lead to SP500 price peaks. Some significant firms are calling for 15% correction today while others are not. In my experience, forecasting short-term market shifts has always proved a very public means of proving one’s market ignorance. These forecasts have a roughly 1 in 9 chance of being right based on a long history of projections not coming to fruition.
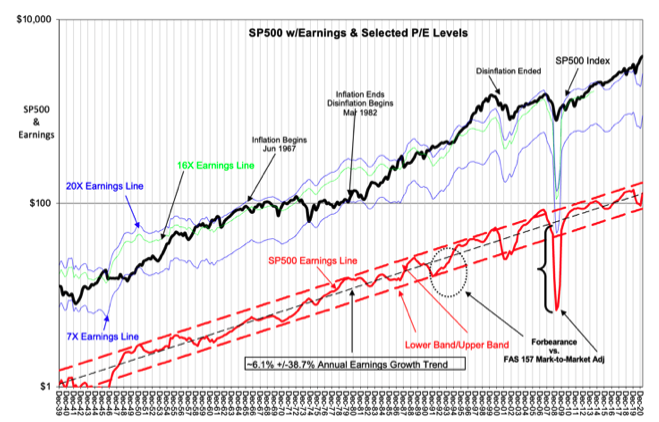
Current conditions reveal we are in an upsurge in SP500 eps (SP500 Earnings Line). Even if SP500 eps rise to the upper trend line, an economic peak has only occurred when the yield curve inverts in a particular fashion. When investors become so optimistic that they believe they cannot lose, they push reserve capital held in T-Bills into equities and businesses. This leave little room for an error in judgement should a correction occur. Corrections, even short-lived ones, can send all scrambling for liquidity. If one is all-in, one has to sell assets and fire employees, retrenching investment capital to escape defaulting on obligations. Once a few companies do this unexpectedly panic rolls through the market place lowering asset prices in anticipation and financial institutions sharply reduce lending. The dominos fall and a recession ensues.
The single most reliable indicator for this occurring in my experience is the yield curve and the T-Bill/10yr Treasury Rate Spread shown as the GRAY DOTTED LINE. Rates are commonly viewed as a measure of the real rate of return US investors seek without other consideration. My experience views rates as a proxy for global market psychology which covers a broad investor calculation of risk/reward on a global scale including risks to property rights and currency exchange rates from confiscatory leadership outside the US. When T-Bill rates are lower than 10yr Treas rates, there is always some reserve capital in markets to counter short-term cash flow ebbs. This gives investors time to adjust to unexpected negatives. After a period of rising economic activity, investors, history reveals, eventually believe they can invest all their capital which drives T-Bill rates higher. Eventually investors drive T-Bill rates higher than 10yr Treas rates producing an inverted yield curve. It is at this point that financial institutions have reduced net interest income and pull-in lending. To borrowers relying on new funding to succeed, default suddenly becomes the only route. With public news of defaults, lending into uncertain ventures rapidly shuts down. A recession follows in short order.
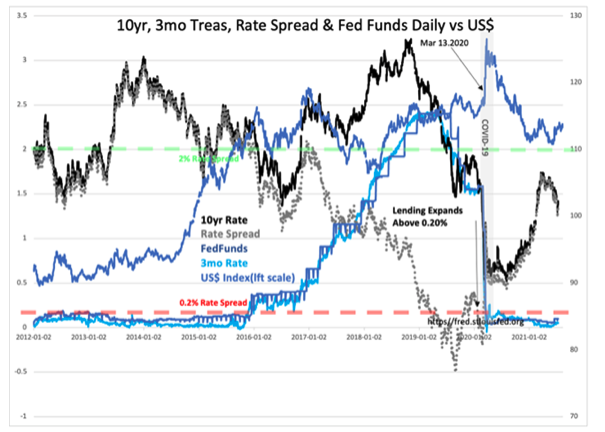
The rate spread has a history from 1953 as a relatively reliable indicator. At the beginning of an economic cycle, the spread is near or below 0.2%. 10yr Treasury rates begin to rise widening the spread as investors regain enough confidence to shift capital into equities and businesses. Roughly half-way through a full cycle the spread rises to 2% or higher and bank lending expands. At the peak of the cycle the spread closes back to 0.2% and lower. The current condition indicates we have some time yet before the spread reaches 2% and even more time before we revisit an inverted yield curve.
Net/net, the call for a 15% market correction, while it could occur, is of little consequence for a longer-term investor seeking to benefit from the full market cycle.
Disclaimer: The information in this blog post represents my own opinions and does not contain a recommendation for any particular security or investment. I or my affiliates may hold positions or ...
more

