
A Different Kind Of Bubble

Information Technology was the top-performing sector in 2020, up 44%, while Momentum (up 28%) was the second best-performing factor. These two results are reminiscent of the bubble we experienced two decades ago. But the Tech sector of today is not your father’s tech sector. Similarly, we can analyze the market from a factor perspective and look at the characteristics of Momentum today versus in the late 1990s. In several respects, the differences outweigh the similarities.
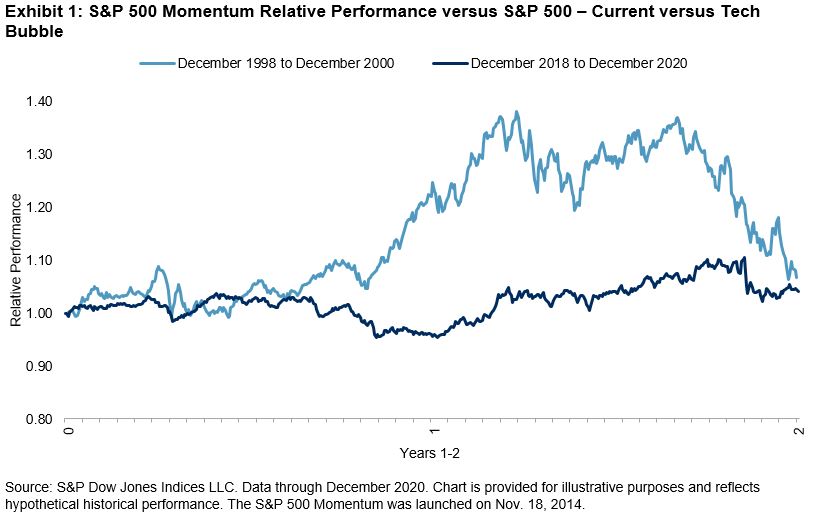
First, the recent run-up in the S&P 500® Momentum Index is much less extreme than during the late 1990s, as we see in Exhibit 1.
(Click on image to enlarge)
Moreover, Exhibit 2 illustrates that the relative volatility of Momentum was much higher then (December 1998-December 2000) than it is now, with an annualized standard deviation of daily relative returns of 15.9%—almost double the current period’s standard deviation of 8.1% (December 2018-December 2020).
(Click on image to enlarge)

Finally, there are significant differences in the current factor exposures of Momentum relative to December 1999. Exhibit 3 shows that the S&P 500 Momentum Index consistently has a strong tilt toward the Momentum factor. Stocks with large cap and low value exposures were outperforming both in 1999 and currently, leading to their inclusion in the Momentum index.
However, the Momentum index’s exposure to the low volatility factor has grown, and its exposure to the high beta factor has diminished. This suggests that the stocks within the current Momentum index are less volatile than they were 20 years ago, substantiating the results we saw in Exhibit 2.
(Click on image to enlarge)

In this era of mega-cap dominance and bubble-like euphoria, concerns about concentration naturally come to mind. Exhibit 4 illustrates that concentration in the S&P 500, measured by the cumulative weight of the five largest constituents, has increased considerably in the past year. The five largest stocks in the S&P 500 composed 20.2% of the total index by weight in December 2020, higher than the December 1999 levels of 16.6%.
(Click on image to enlarge)

If indeed we are in the midst of a bubble, it is important to understand the differences compared to past ones. And while timing the end of a bubble is no small feat, we know that the market experienced a reversal in Q4 2020, with the comeback of smaller caps and Equal Weight. If these trends continue, then a subsequent decline in concentration and shift in the factor make-up of the market could be in the cards.
Disclaimer: Copyright © 2020 S&P Dow Jones Indices LLC, a division of S&P Global. All rights reserved. This material is reproduced with the prior written consent of S&P DJI. Please ...
more

