
A Deep & Dark Relative Strength Index (RSI) Secret
I’m about to reveal one deep RSI strategy that many pro traders use. It will help you create screeners to pick trending stocks for intraday to medium-term trading. Before I spill the beans, let’s dig deeper into RSI to understand this momentum indicator is considered so potent.
Understanding RSI (Relative Strength Index)
I’m assuming here that you know that RSI is set to 14 periods by default and that one period can be equal to the time you choose on the charts (one minute to one month).
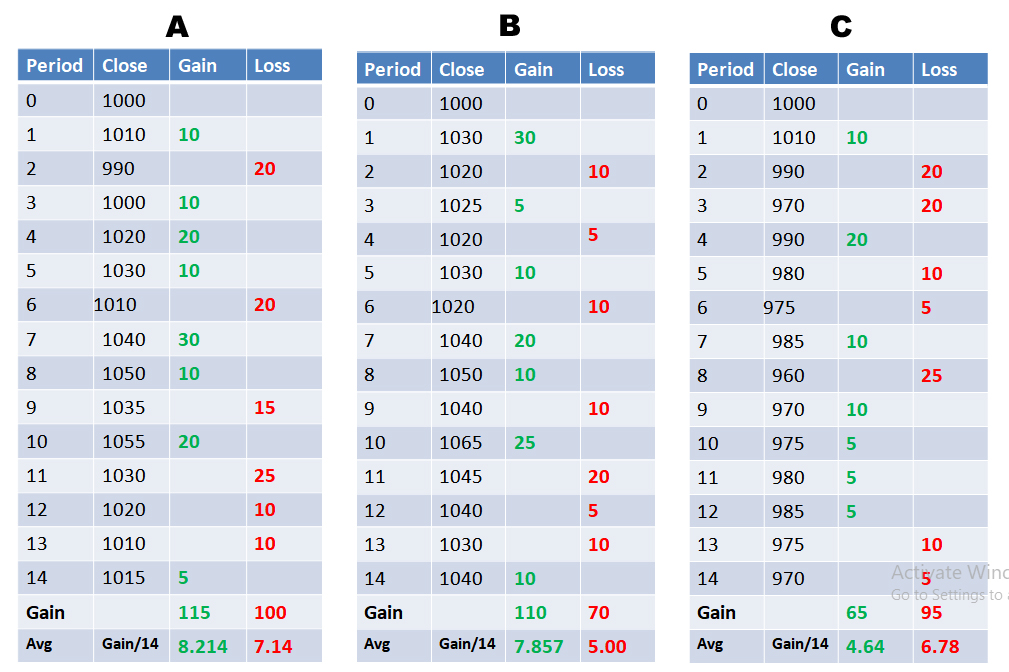
With that said, check the following image. The three scenarios, A, B, and C, contain the closing price of a stock for 14 periods.
RSI works by
(a) Deducting the previous close from the current close. The difference is plotted as a loss or gain, as the case may be.
(b) Averaging the gains and losses after totaling these up for 14 periods.
(c) In the third step, it averages the gains and losses by dividing these by 14 (the default RSI period setting)
Next, the following formula is applied to the average gains and losses:
RSI = 100 – [100 / (1 + (Average Gain / Average Loss) )]
The RSI that is derived for each of the following scenarios is:
For scenario A, the RSI is 53.49
For scenario B, the RSI is 61
For scenario C, the RSI is 40.62
Take a hard look at these statistics:
In scenario A, the average gains were 115% of the average losses, the price appreciated 1.5% (1000 to 1015), and the RSI was 53.49.
In scenario B, the average gains were 157% of the average losses, the price appreciated 4% (1000 to 1040), and the RSI was 61.
In scenario C, the average losses were 146% of the average gains, the price depreciated 3% (1000 to 970), and the RSI was 40.62.
From the examples above, we can say:
(a) That when RSI is around 53-54, the gains over the last 14 periods are marginal (1.5% price gain and 115% average gain/average loss).
(b) That when RSI is 60+, the gains over the last 14 periods are substantial (4% price gain and 157% average gain/average loss)
(c) That when RSI is around 40 and lower, the losses over the last 14 periods have started ballooning (3% price loss and 146% average loss/average gain).
The momentum of this indicator lies in the average gains and losses. For example, notice that when RSI crosses above 60, the average gains are substantially higher than the average losses, and vice versa when RSI crosses below 40. It’s like a revving superbike that has just gotten the GO signal.
Therefore:
(1) When RSI crosses above 60, it is a bullish signal
(2) When RSI crosses below 40, it is a bearish signal
But all this information is meaningless until we understand the importance of periods.
Critical RSI-related Chart Periods
When RSI crosses above 60 on the 1-minute charts, you can conclude that a bullish movement will occur in the next 5-10 minutes. The same logic, in the same proportion, will hold for a 5-minute period.
As the time periods increase, the signals start becoming more durable. So, many pro traders use longer chart periods to ensure that the RSI signal is reliable and enduring. To be specific, many traders use Day, Week and Month periods to enter into trades that range from intra-day to the long term.
Here are the screener formulas that are used:
RSI Secret Screener Formulas
BULLISH SCREENERS
|
PERIOD |
RSI CROSSES ABOVE |
ACTION |
|
DAY |
60 |
Consider buying when price crosses above 15M VWAP for Intraday Gains |
|
WEEK |
60 |
Consider buying when price crosses above 1H VWAP for a swing trade |
|
MONTH |
60 |
Consider buying when price crosses above 2H VWAP for intraday. Consider buying ATM or slightly OTM call options. |
BEARISH SCREENERS
|
PERIOD |
RSI CROSSES BELOW |
ACTION |
|
DAY |
40 |
Consider selling when price crosses below 15M VWAP for Intraday Gains |
|
WEEK |
40 |
Consider selling when price crosses below 1H VWAP for Intraday Gains |
|
MONTH |
40 |
Consider selling when price crosses below 2H VWAP for the intraday. Consider buying ATM or slightly OTM put options. |
Backtesting
It’s time to lay the evidence on the table.
As 1-Day period is used for intraday trades, let’s focus on the weekly and monthly RSI signals for two key stocks, Tesla and Amazon:
(Click on image to enlarge)
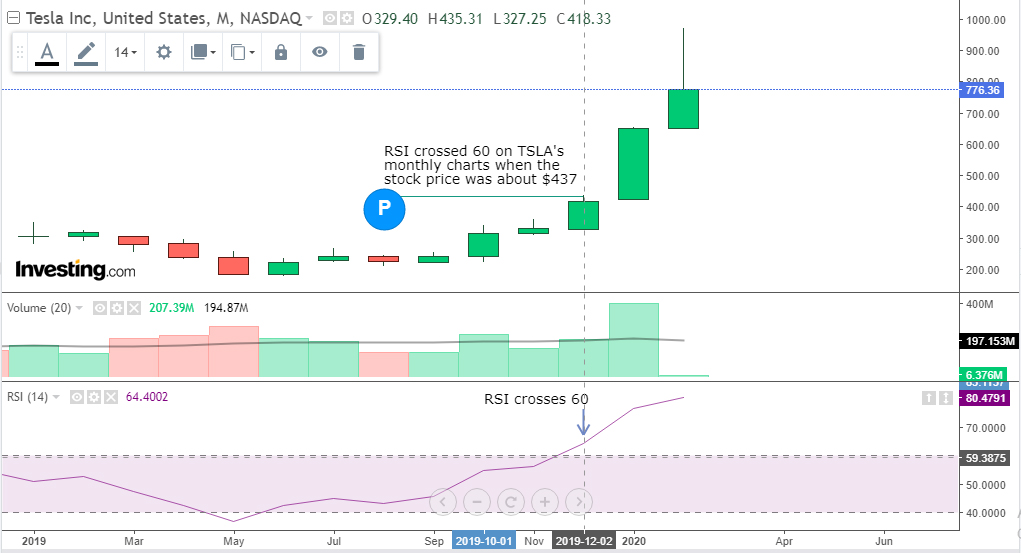
EXAMPLE 1: Notice how Tesla (TSLA) flared up after RSI crossed above 60 on the monthly charts in Feb 2020. At that time, TSLA was around $430.
(Click on image to enlarge)
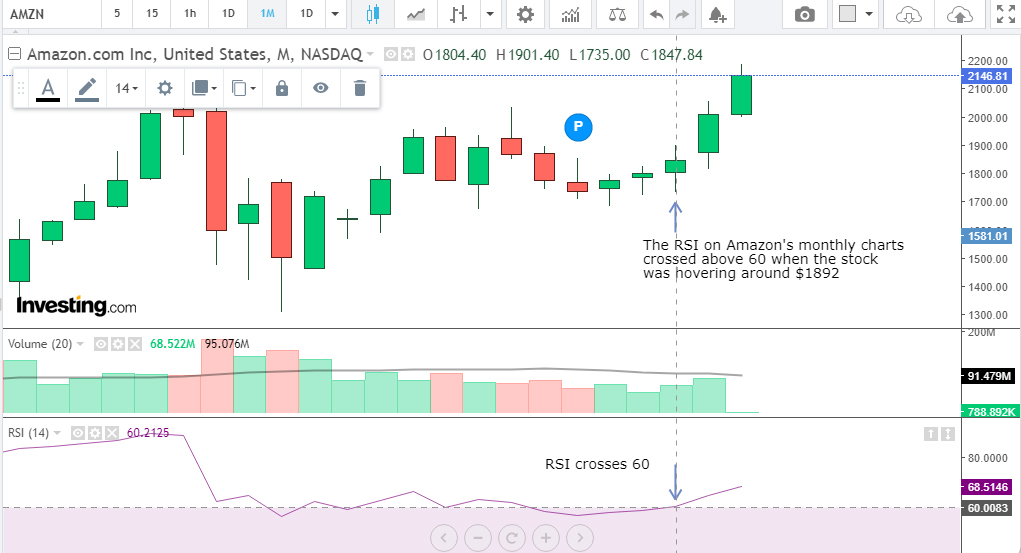
EXAMPLE 1: Check how Amazon (AMZN) zipped up after RSI crossed above 60 on the monthly charts. At that time, AMZN was around $1892.
You may backtest and forward-test stocks whose RSI has crossed above 60 on the Weekly and Daily charts and stocks where RSI crossed below 40 on longer time frames.
Setting up RSI Screens
If you are familiar with using screeners and know where to set one, please disregard this section.
However, if you don’t, here’s how to set up one:
You can consider using the Trading View screener. Trading View comes free for longer time frames (Day, Week, Month). The screener updates prices once every second and that is adequate considering that you are using longer timeframes.
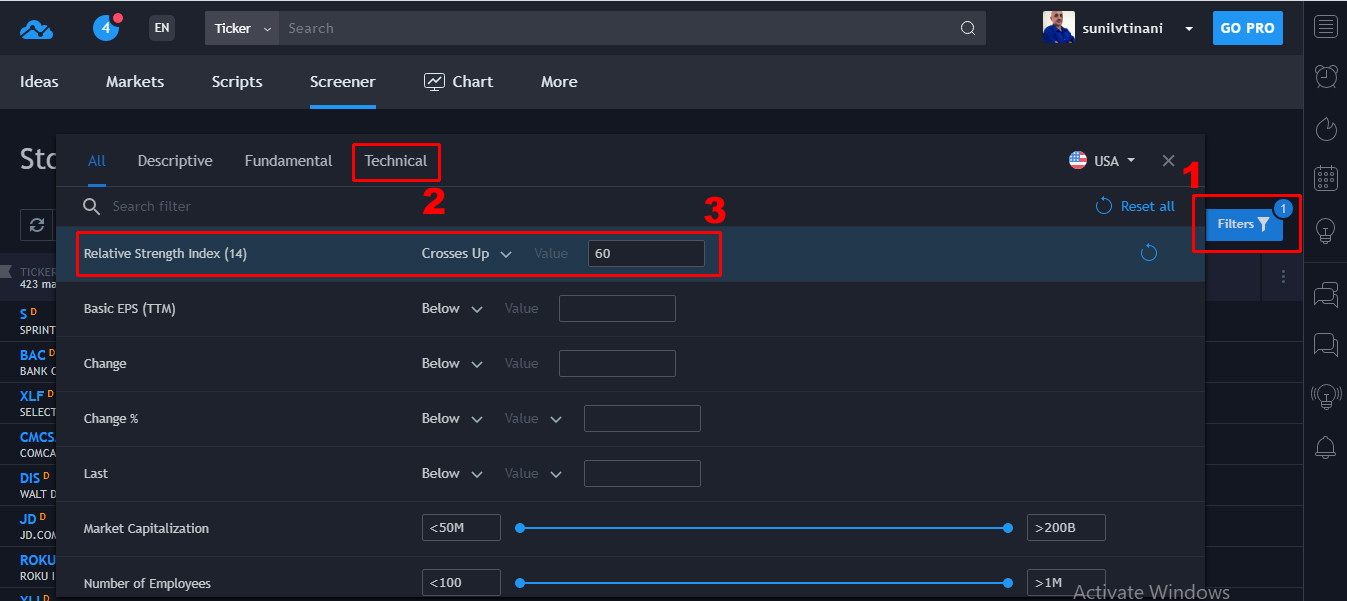
Step 1: Set up the filter: (1) Choose Filter (2) Select “Technical” (3) Set RSI (14) “crosses up” 60
(Click on image to enlarge)
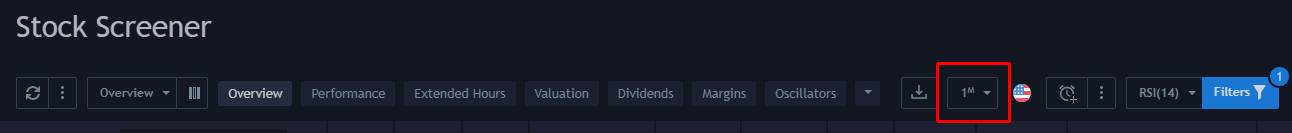
Step 2: Choose the period that you’d like to test
Follow the same steps while setting up the bearish screen (RSI crosses below 40).
Steps to Follow After Picking Stocks
1. Always check the news, especially from independent authoritative sources. This information can help you firm up your trading decision.
2. Remember that indicators are not an exact science and there’s no guarantee that stocks will move in a particular direction because indicators say so. Therefore, work with stop losses and do not get carried away.
3. Week and Month period signals are extremely potent and therefore you may also consider trading options based on them.
4. Act on the signal after the price crosses above (bullish) or below (bearish) an overlay indicator that you are comfortable with. VWAP (Volume Weighted Average Price) is recommended.
Go ahead and practice this lesson in paper trades and drop in a comment if it works out, or if you have any questions.
Disclosure: I have no position in the stocks discussed, and neither do I plan to buy/sell it in the next 72 hours. I researched and wrote this article. I am not being compensated for it (other ...
more

