
A Confused Goldman No Longer Expects S&P To Drop To 2,400 But Sees No Market Upside Either
Another Goldman forecast is flushed down the drain.
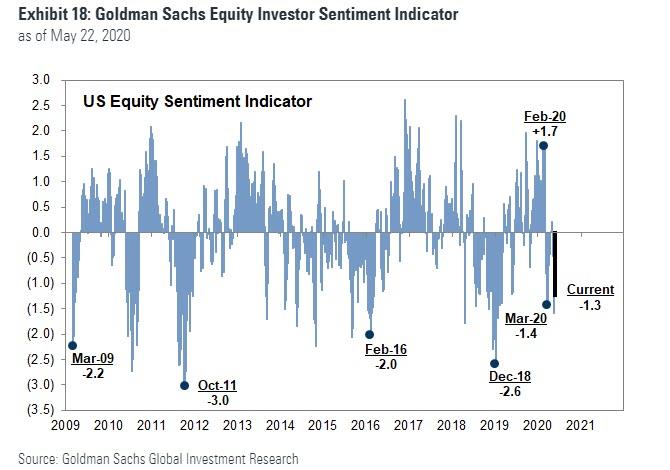
Six weeks after Goldman pulled its knee jerk-forecast following the March crash, in which it saw the S&P sliding as low as 2,000 in the second wave of selling due to "unprecedented policy support", yet expecting the S&P to retest the bottom end of the range,and slide to 2,400 over the next three months, the bank's chief equity strategist David Kostin today said that the market's powerful rebound means "our previous 3-month target of 2400 is unlikely to be realized" as "monetary and fiscal policy support limit likely downside to roughly 10% (2750)." Additionally, Goldman - which urged its institutional clients to be bearish and on the other side of what's left of its prop trading desk - adds insult to injury saying that "Investor positioning has oscillated between neutral and low" (wonder why, when none other than Goldman was expecting a pullback to 2,400 by August less than three weeks ago) and says that it now represents "a possible 5% upside catalyst (3200)" to its year end price target of 3,000.
Explaining his change in sentiment, which incidentally comes one day after JPM's Marko Kolanovic "dialed down" his optimism on equities, Kostin writes that most institutional investors view the 35% rebound in the S&P 500 index from the bear market low as "Unloved, but welcome."
It is unloved because most portfolio managers were not positioned to take full advantage of it. However, it is welcome because most investors are structurally long-biased. The magnitude and persistence of the index recovery has certainly surprised us.
In fact, so bizarre were the "remarkable" were the past 90 days that Kostin dedicates his entire preamble to summarize what happened:
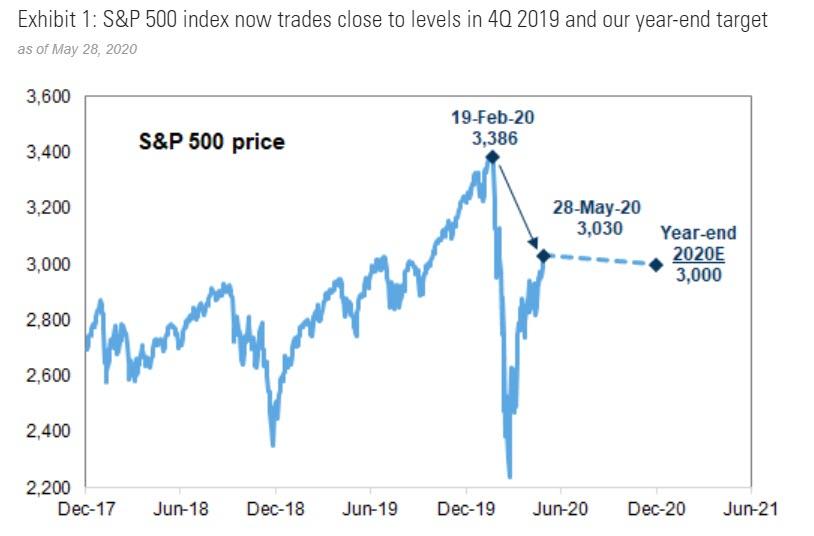
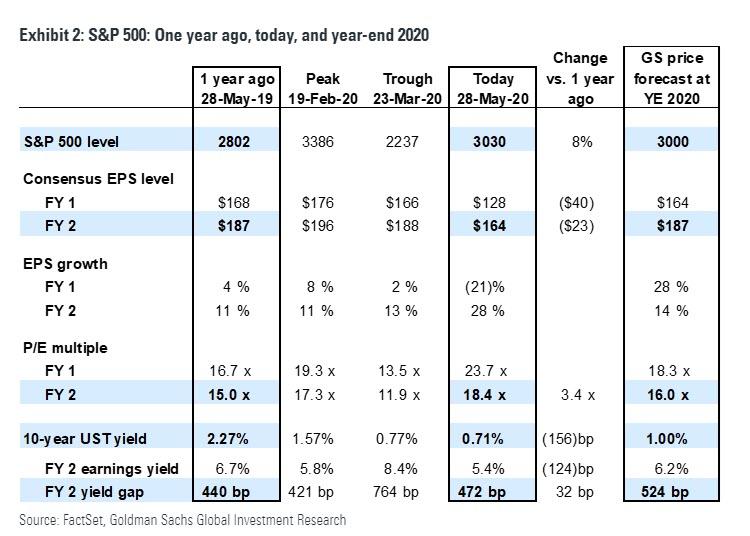
- On February 19, 2020, the S&P 500 closed at 3386, an all-time high. Roughly three months later, the index stands 11% lower at 3030 and -6% YTD. But point-to-point changes in the level of an equity index do not capture the traumatic medical events, extraordinary economic disruption, widespread social upheaval, and tumultuous path of financial assets that occurred during the intervening 90 days.
- More than 100,000 Americans have died of COVID-19 according to Johns Hopkins University. The US unemployment rate has surged from a 50-year low of 3.5% to 14.7%, the highest level since the Great Depression. More than 40 million people have filed initial unemployment claims since late February. Goldman Sachs US Economics forecasts the unemployment rate will spike to 25% before ending the year at 12%.
- S&P 500 troughed on March 23rd after plunging by 34% in 23 trading days. Equities bottomed concurrent with the announcement by the Federal Reserve that it would support the investment-grade bond market and relieve liquidity and solvency pressures threatening many US firms. Congress also acted swiftly and passed the CARES Act that extended support to small businesses and provided extended unemployment benefits to individuals who lost their jobs due to the pandemic.
- The index has rallied by 35% during the past 46 trading days. The S&P 500 index closed at 3030 on May 28th and now trades just 11% below its all-time high reached slightly more than three months ago. It has been a remarkable journey.
According to Kostin, five key drivers powered the rally which the strategist failed to see:
- A series of critical monetary policy initiatives by the Fed;
- massive fiscal stimulus by Congress;
- a bending of the viral curve in the US;
- a narrow group of large-cap stocks that lifted the cap-weighted index while the typical stock lagged;
- optimism about the restart of the economy.
Whatever the drivers, the Goldman strategist writes that the S&P 500 now trades at his year-end 2020 target of 3000 (which is about 23x 2021 S&P EPS).
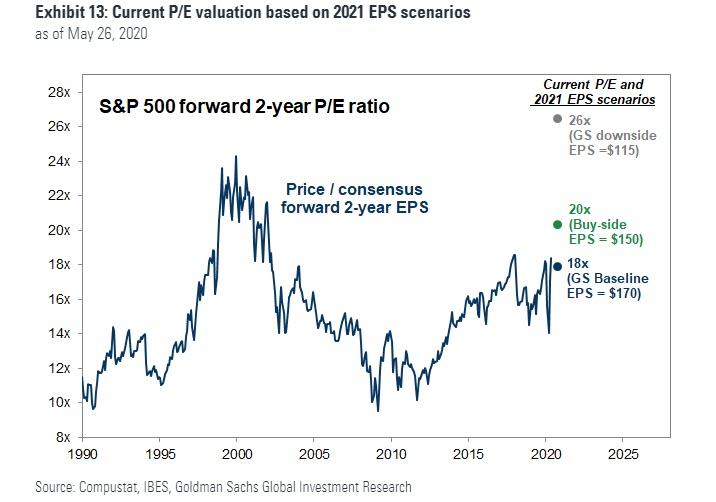
Furthermore, Kostin notes that the bank's "baseline 2021 EPS forecast of $170 represents a best-case scenario -- achievable, but definitely optimistic" and adds that the current valuation based on the macro model implies business steadily normalizes. If these developments transpire, Kostin writes that "at year-end 2020 the S&P 500 will be trading at 18x our 2021 EPS estimate and 20x buy-side expectations," and 26x its downside case scenario.
Having reluctantly admitted he failed to predict the rally, Kostin next notes that "the risk of an economic, earnings, trade, or political hiccup to normalization means near-term returns are skewed to the downside, or neutral at best."
But, as noted above, "the powerful rebound means our previous 3-month target of 2400 is unlikely to be realized." And while monetary and fiscal policy support limit likely downside to roughly 10% (2750), bearish investor positioning - which has oscillated between neutral and low - is a possible 5% upside catalyst (3200).
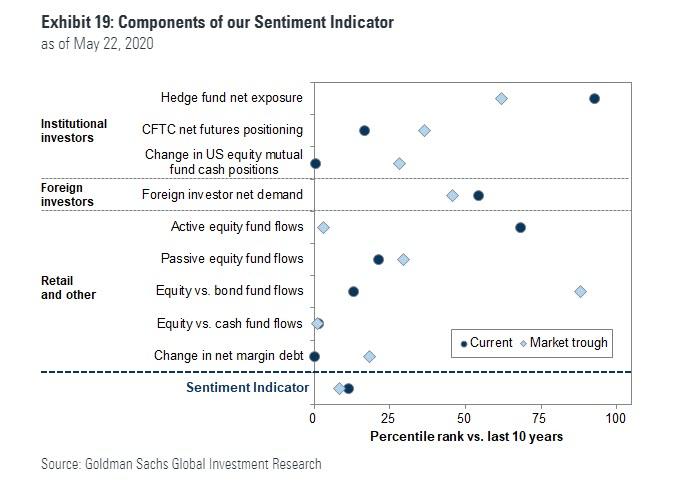
Drilling down into the chart above, Goldman writes that institutional investors, such as mutual funds, are among the investor categories with the most room to increase their equity allocations. Kostin references the CFTC net futures positioning which has continued to decline from levels at the market trough and mutual fund cash positions jumped to a two-year high in March. At the same time, money market funds have experienced effectively no reversal of the $1.2 trillion of inflows experienced during the past three months. Money market mutual fund assets now total $6.0 trillion, which is dry powder that can be used to chase stocks, while "Reduced outflows from active mutual funds could also support equity purchases by this cohort."
In contrast, both hedge funds and retail investors already appear relatively optimistic on the current market outlook. While hedge funds have historically cut leverage and been left underexposed for the ensuing rebound, during the recent sell-off funds cut net leverage by less and stopped cutting at a higher level of exposure compared with previous drawdowns. In fact, contrary to widespread speculation that hedge funds have not participated in the rally, net exposures calculated by GS Prime Services currently rank in the 92nd percentile in the past 10 years. Similarly, data from retail brokerages show roughly a tripling in retail investor trading activity this year.
Mea culpa in hand, Goldman then pushes back on calls for even more upside, admitting that "from a fundamental perspective, the upward trajectory of the US equity market during the past two months is unlikely to persist for several reasons..."
(1) Our S&P 500 earnings growth expectations for 2021 are achievable, but optimistic, and investors will need to see more evidence that firms across all industries can deliver on those projections;
(2) Based on our macro model, the current index level implies normalization occurs smoothly and meeting that expectation will only support and validate the existing market level rather than push it higher; and
(3) The current rally has generally been powered by a small group of secular growth stocks. A further advance in the index will require broader participation by more economically-sensitive companies but many of these firms will have lower earnings next year than in 2019."
Another caution from Kostin is that the blistering rebound of the S&P 500 index overstates the performance of the typical stock. Consider the following:
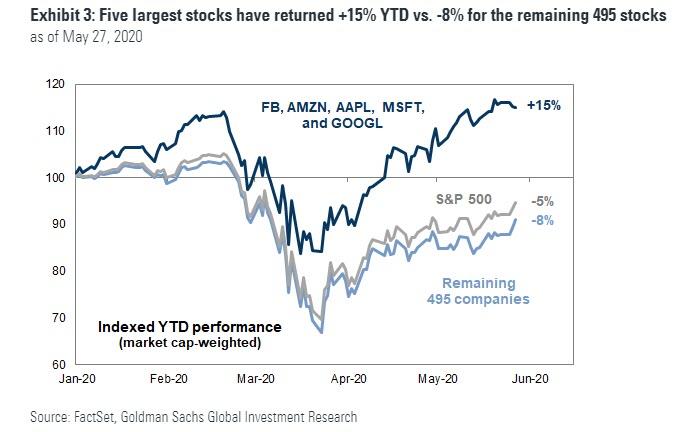
- The equity capitalization-weighted S&P 500 index has rebounded by 35% from its low and now trades just 11% below its all-time high. The index return since the start of the year is -6%.
- And yet, at the same time, the average stock has returned -13% YTD. The equal-weighted S&P 500 index trades 15% below the record high and has lagged the cap-weighted index by 650 bp this year, a testament to the narrow breadth of the index recovery.
Indeed, the stellar return of the five largest stocks in the S&P 500 -- MSFT, AMZN, AAPL, GOOGL, and FB -- is the primary explanation for the large difference between the cap-weighted index and the average stock
Reminding clients that the current aggregate index weight of the five stocks with the largest market caps - the FAAMGs - is the highest in history.
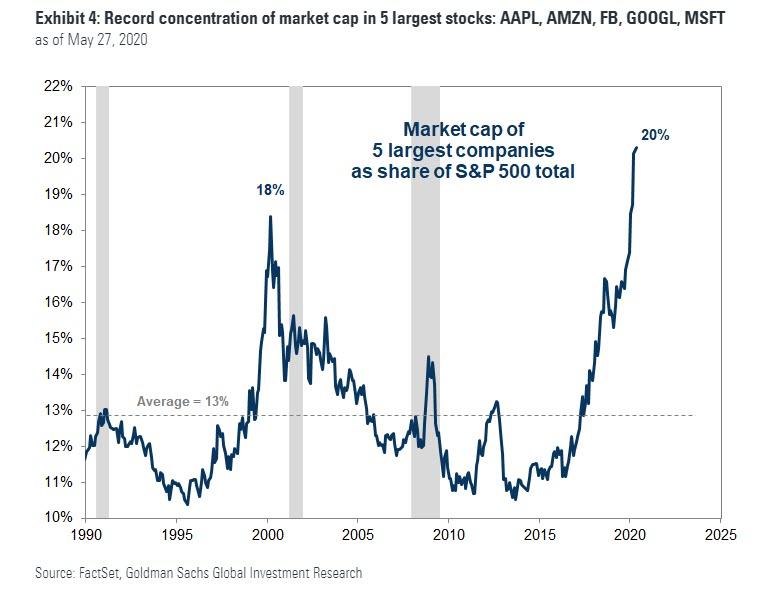
Kostin writes that broader participation in the rally will be needed in order for the aggregate S&P 500 index to climb meaningfully higher. This won't happen according to Goldman equity research analysts, who currently forecast just 1% upside for the cap-weighted group of the five stocks. The modest upside for the largest stocks means the remaining 495 constituents will need to rally to lift the aggregate index.
There are two other key market-related risks to further upside according to Goldman:
- The first, as noted above are the elevated positions of hedge funds and retail investors, which suggest that purchases by the two investor classes have now likely peaked.
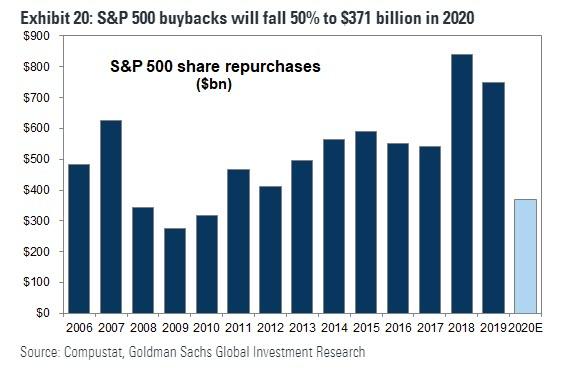
- Second, Kostin warns that the sharp ongoing reduction in buybacks poses a risk to the balance of US equity supply and demand. US companies have represented the largest source of demand for US equities each year this cycle. However, plunging cash flows are leading to a sharp reduction in repurchase activity this year. So far, nearly 100 S&P 500 companies have suspended their buyback programs this year, accounting for more than 40% of 2019 buyback executions. Goldman forecasts S&P 500 gross buybacks will decline by 50% to $371 billion in 2020 from $749 billion in 2019. Consequences of the sharp reduction in corporate repurchases include lower EPS growth, higher share price volatility, and lower equity valuations.
Finally, there are several macro risks exist to Goldman's forecast:
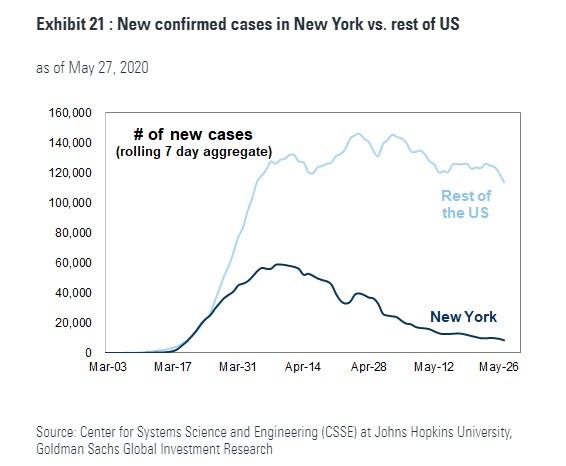
1. Medical developments could go in either direction with a successful antiviral therapeutic or a vaccine representing obvious upside catalysts, while a second wave of infections would be a disappointing and downside development. Investors often cite the declining number of cases in the US as evidence of progress on the health care front. But outside of NY, the case load for the rest of the US has remained relatively steady.
2. Companies may rehire fewer employees or at a slower pace than investors currently expect. As economic activity has frozen, many firms are borrowing money to finance ongoing operations during the downturn. Even with low interest rates, elevated corporate leverage means more debt service in the future and less free cash flow for companies to spend, ultimately restraining the pace of recovery. In the wake of the COVID-19 disruption, companies are accelerating the trends of digitization, automation, and direct-to-consumer business. This fact was clearly apparent in management commentaries across industries during the recent 1Q 2020 quarterly earnings calls.
3. Trade friction between the US and China is rapidly escalating. Based on the heated rhetoric from politicians in each country, the situation seems likely to get worse before it gets better. Greater geopolitical instability is typically associated with lower valuations.
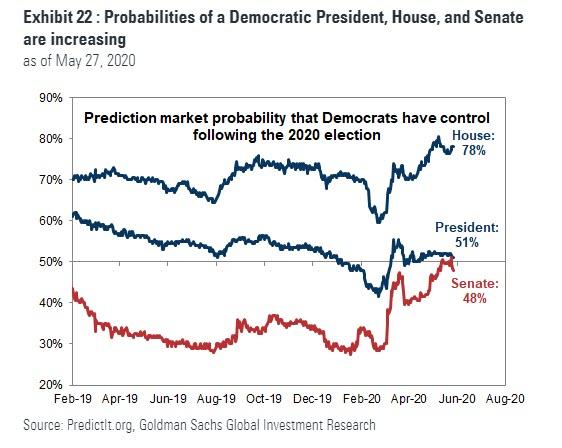
4. Perhaps the most significant risk and source of uncertainty is the US election that is now just five months away. Prediction markets currently assign a 78% probability the Democrats control the House of Representatives, a 51% likelihood of occupying the White House, and a 48% probability of controlling the Senate. The tax reform law passed in late 2017 lowered the median effective corporate tax rate (federal plus state) to 19% from 27%. If the tax law is reversed, it would translate into an 11% reduction in our 2021 EPS forecast (to $150 from $170, and buy-side consensus would fall to $133 from $150). If that development occurs, the S&P 500 index would now be trading at 20x our 2021 adjusted EPS forecast and 23x buy-side consensus expectation.
Disclaimer: Copyright ©2009-2020 ZeroHedge.com/ABC Media, LTD; All Rights Reserved. Zero Hedge is intended for Mature Audiences. Familiarize yourself with our legal and use policies every ...
more

