
A Changing Stride For An Aging Bull
Taking a cue from Frank Sinatra, the S&P 500 was riding high in April, shot down in May, and got back on top in June. But the current bull run is feeling its age, and we may be witnessing a change in its stride. Coming into the end of the quarter (all figures are as of June 25th), here’s my take on the current market drivers.
Notwithstanding a surprise move down in the next couple of days, the S&P 500 looks set to end Q2 with a solid gain after the best June in decades. However, the rebound from May has not been a typical “risk on” rally. Concerns over slowing global growth, trade disputes, and geopolitical tensions have boosted defensive assets and the fixed income markets are pricing in a sharp loosening in policy on both sides of the Atlantic.
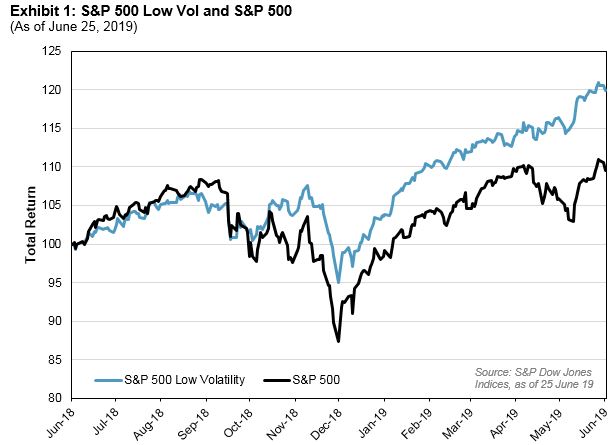
Low Volatility Outperforming Despite Market Gains
The S&P 500 Low Volatility has been a shining star in U.S. equities both this quarter and over the last year. Including the 100 stocks from the S&P 500 with the lowest 12-month trailing volatility, “Low Vol” does not typically outperform during large market upswings, but when the market declines, Low Vol typically declines by less. Historically, the benefit of capturing less of the downside and more of the upside has compounded, giving Low Vol a better long-term return despite the decrease in risk. More recently, however, Low Vol has outperformed in the market upturn, which has given an unusually defensive feel to the rally.
(Click on image to enlarge)
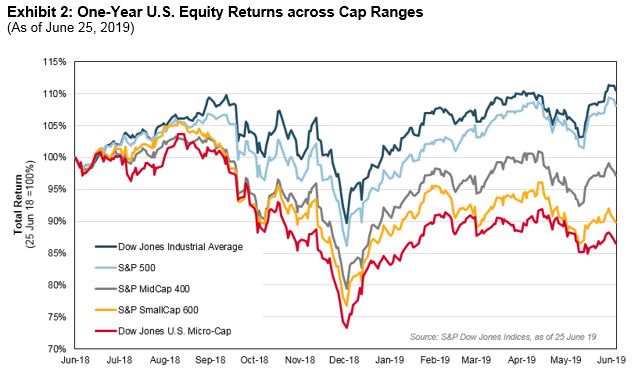
Along with the outperformance of Low Vol, the performances of larger and smaller companies (which typically outperform in periods of strong economic gains) also sound a note of caution. Over the past 12 months, the S&P SmallCap 600® has declined 9%, compared to a gain of 10% in the S&P 500. Microcaps have struggled, even more, underperforming large caps by a whopping 22%.
(Click on image to enlarge)
Trade Winds Blowing
The ongoing trade dispute between China and the United States has been top of the market’s mind for over a year now, and with Presidents Trump and Xi due to meet at the G20 Summit in the final days of June, the potential for a major repricing looks set to accompany us right up until the quarter’s end. (Pity those who will have to wait until the very end of the month to draft their reports!)
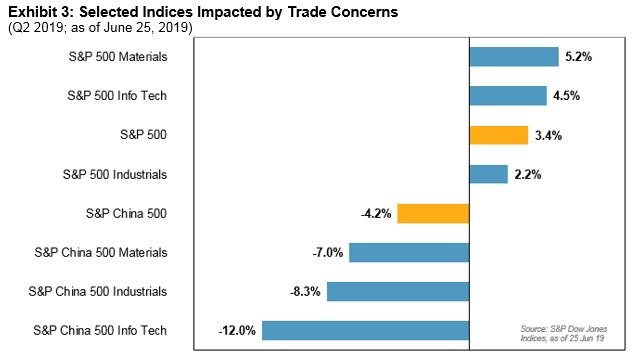
But who’s “winning” the trade war? If we pick the more U.S./China trade-sensitive sectors, namely Industrials, Materials and Information Technology for our indicators, it seems that U.S. companies are having a better time of it than their Chinese counterparts.So far this quarter, the former have all gained, the latter have all declined (all in USD terms, although a comparison in CNY would draw a similar conclusion). While few believe that a final deal is imminent, the mood music shifted a bit after U.S. Treasury Secretary Steve Mnuchin said that an agreement was 90% completed. As ever, the devil still lies in the details.
(Click on image to enlarge)
Europe – Back to the Future?
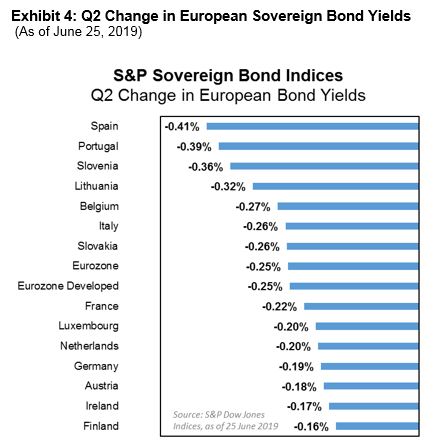
European bonds and equities and have also jumped this quarter, with both the S&P Europe 350® and the S&P Eurozone Sovereign Bond Index rising 3% quarter-to-date.
Although the European bloc has managed to remain mostly out of the trade crosshairs (at least, for now), economic growth continues to look elusive. While the European Central Bank has long called for fiscal reforms and offered further stimulus if needed, their June meeting seemed to indicate that the second course was the more likely. Broadly speaking, the recent rally has a bit of a nostalgic feel to it: dovish central banks are driving the markets, leading to a “bad news is good news” mindset from investors.
(Click on image to enlarge)
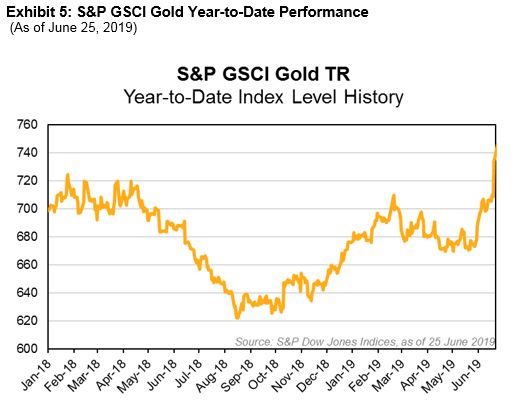
But have markets set themselves up for disappointment? As ‘the bull market that everyone hates’ drags on, it appears that additional stimulus from central banks have already been priced in, leaving policymakers in a precarious position of either giving the market what it expects or leaving it wanting. While some are waiting for more clarity, it appears others may be shifting into the safety of a shinier haven; the S&P GSCI Gold has soared into the quarter’s end, standing now with a gain of 9% since April.
(Click on image to enlarge)
Copyright © 2018 S&P Dow Jones Indices LLC, a division of S&P Global. All rights reserved. This material is reproduced with the prior written consent of S&P DJI. For more information ...
more

