
A Better Than Average Decade
The S&P 500 rallied 3.6% on a total-return basis in November, which was the best monthly return for the index since June but surprisingly only the fourth-best month so far in 2019. That’s how strong equities have been this year! This November was also the best November for the S&P 500 since 2016 after President Trump was elected. While the S&P 500 is currently up 27.6% YTD on a total return basis, over the last 12 months, the index is ‘only’ up 16.1%. That’s how bad last December was!
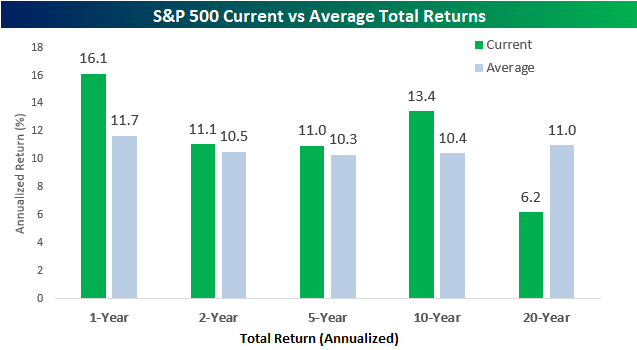
The chart below compares the S&P 500’s annualized returns over the last one, two, five, ten, and twenty years to the average annualized returns of the index for each time period since 1928. The S&P’s current one-year return is already well above its historical average of 11.7%, and barring a major decline in December, this number will be even more skewed a month from now. While the one-year gain is well above average, both the two and five-year annualized returns are actually pretty much right in line with the historical averages.
Longer-term is where the current returns relative to average are really skewed. Over the last 10 years, the S&P 500’s average annualized return of 13.4% is a full three percentage points higher than average. That may not sound like an enormous difference, but over time it adds up; 13.4% compounded over 10 years works out to a cumulative gain of 252% whereas 10.4% compounds to just 169%. While 10-year returns are well above their historical average, returns over the last 20 years have been well below average at 6.2% vs 11.0%. A three percentage point difference adds up over 10 years, but a spread of five percentage points over a 20-year period is enormous. While one could expect to multiply their original investment by seven times if it compounded at 11% annually over a 20-year period, that same investment wouldn’t even multiply by 2.5 times at a rate of 6.2%!
(Click on image to enlarge)
The chart below ranks the S&P 500’s current one, two, five, ten, and twenty-year returns on a percentile basis versus all other periods. Interestingly, the S&P 500’s current one-year performance only ranks in the 58th percentile relative to all other 12-month periods, and the two and five-year returns are both slightly below the 50th percentile. The real extreme, though, is in the S&P 500’s 20-year performance which ranks in just the 5th percentile of all other 20-year periods in the index’s history. As good as the last decade has been for bulls, the decade before was truly treacherous.
(Click on image to enlarge)
![]()
Sign up for Bespoke’s “2020” special and get our upcoming more


