
A Banner First Half For Homebuilders As Mortgage Rates Fall
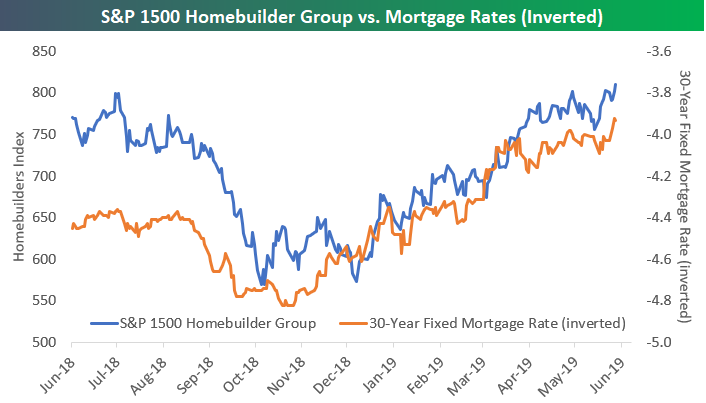
After a very weak second half of 2018 due to rising mortgage rates, the S&P 1500 Homebuilder group has rallied 35% in 2019 to a new 52-week closing high as of last Friday. Below is a chart of the S&P 1500 Homebuilder group vs. an inverted look at Bankrate.com’s 30-year national average fixed mortgage rate. The Homebuilder group bottomed right around the time that mortgage rates peaked, and they’ve been rallying as mortgage rates have been falling.
(Click on image to enlarge)
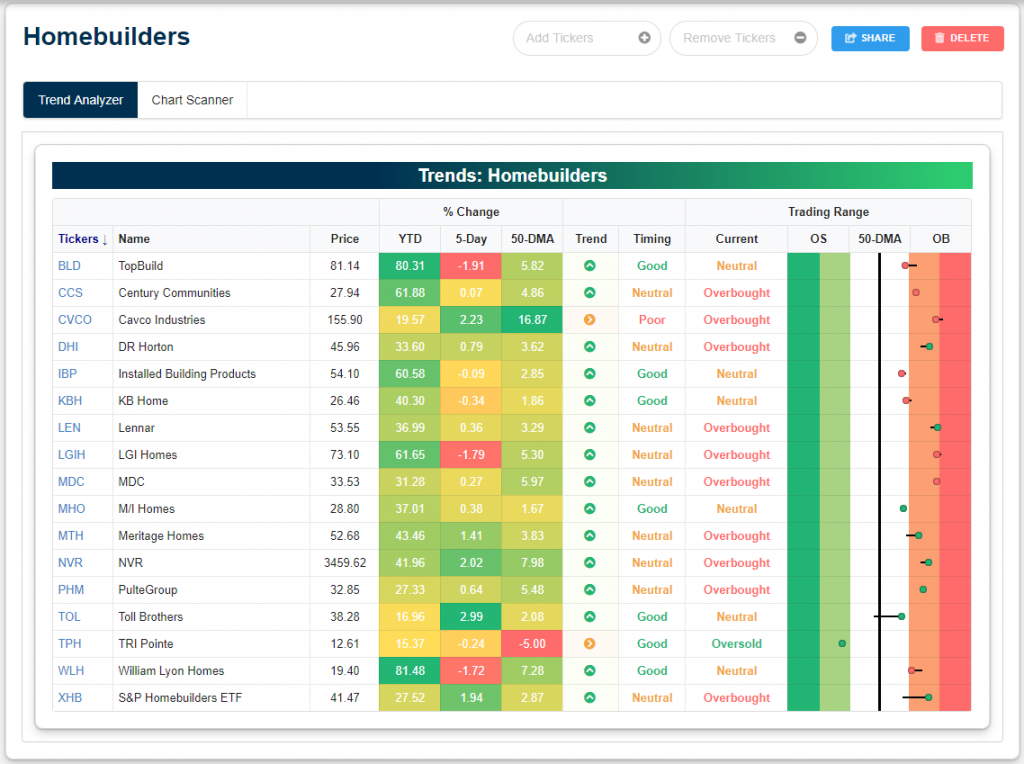
Below is a custom portfolio we’ve built on our website to see how the individual members of the S&P 1500 Homebuilders group look. As you can see, every single stock in the group is up at least 15% year-to-date, with some like TopBuild (BLD), Century Communities (CCS), LGI Homes (LGIH), Installed Building Products (IBP), and William Lyon Homes (WLH) all up more than 60%!
At the moment, all but one of the homebuilder stocks is in a sideways trend or long-term uptrend pattern. The majority are also overbought, meaning they’re currently trading more than one standard deviation above their 50-day moving averages.
(Click on image to enlarge)
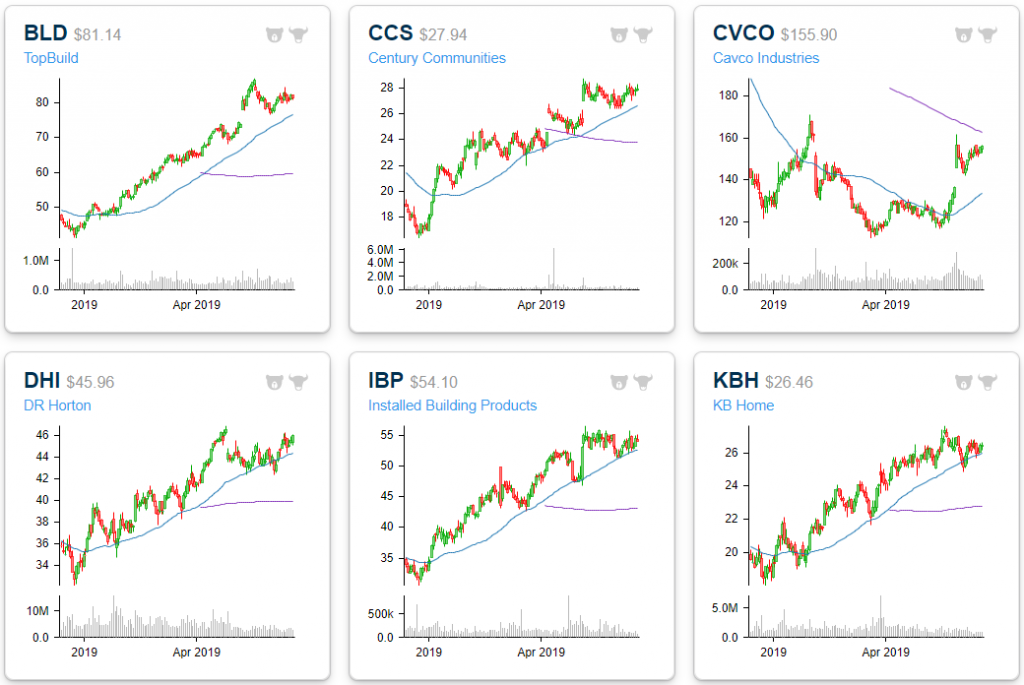
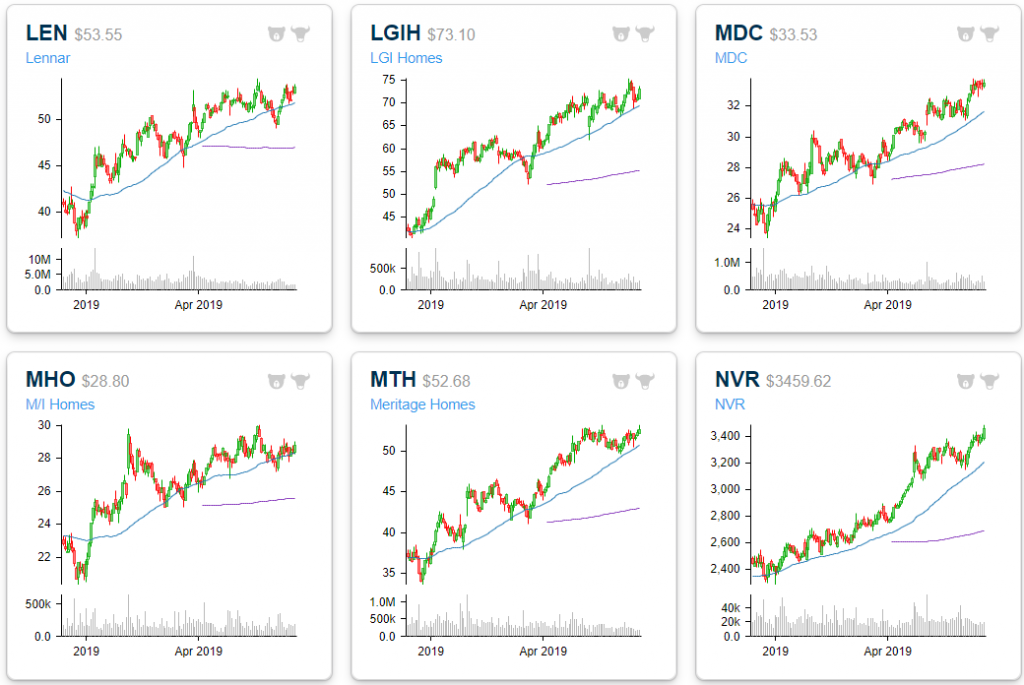
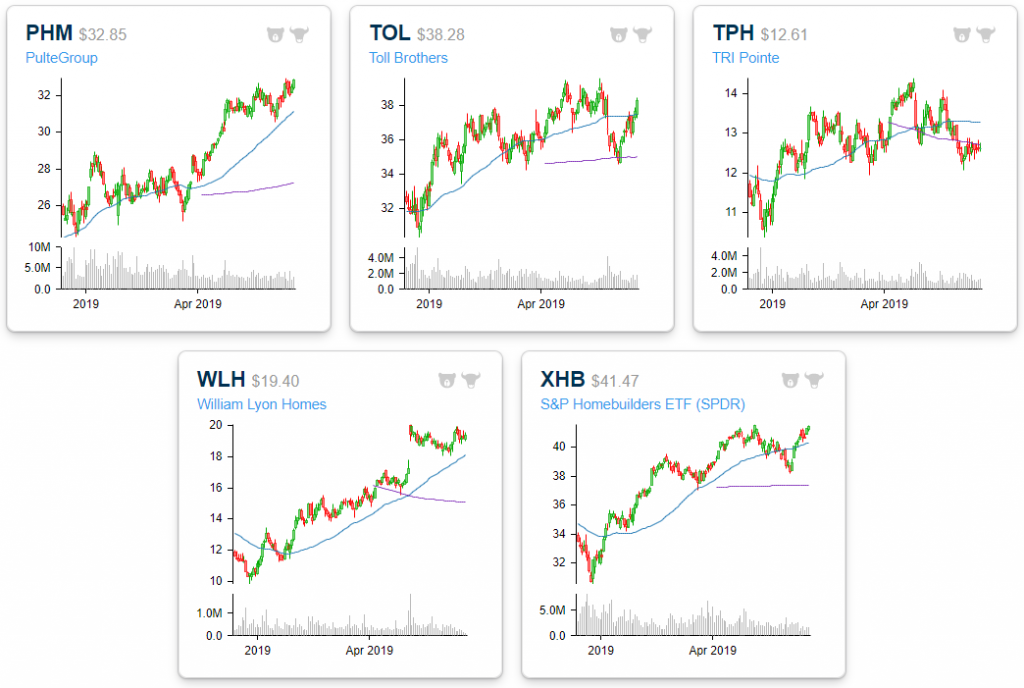
Below we show the individual chart patterns for the homebuilder stocks. Here you can see that the entire group is made up of mostly bullish chart patterns, with prices trending up and to the right. Most 50-day moving averages (blue lines) are pointed higher, and the 200-day moving averages (purple lines) are starting to turn higher as well.
(Click on image to enlarge)
(Click on image to enlarge)
(Click on image to enlarge)
Start a two-week free trial to Bespoke Premium to create your own custom portfolios now and also unlock Bespoke’s ...
more

