
9-Year U.S. Bull Market Run: Will We See A10th?
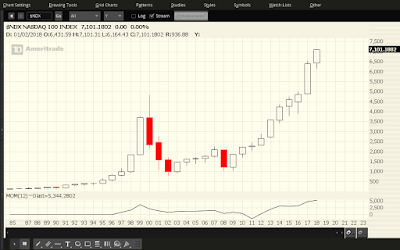
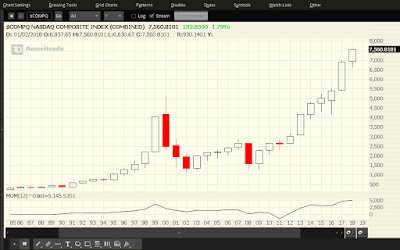
Each candle on the following five charts of the Major U.S. Indices represents a period of one year.
You can see at a glance that we're still ensconced in a bull market that began in 2009 when the Fed first began their QE monetary policy.
In fact, both Tech indices closed at new all-time highs on Friday and haven't experienced much of a pullback, so far, this year, compared with the other three relative to last year's candle (thanks, in large part, to the FAANGs, as shown on the daily chart grid below)...indicating that the bulls are still in charge of equities, overall.


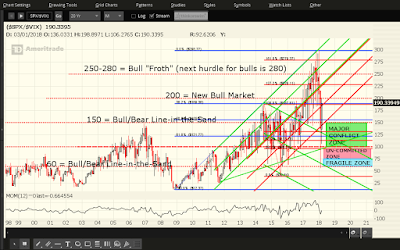
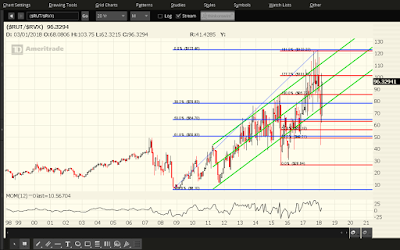
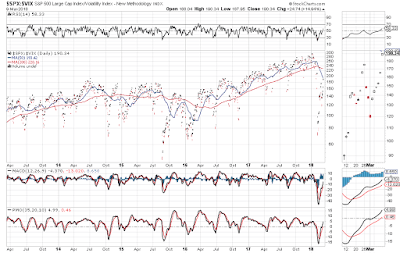
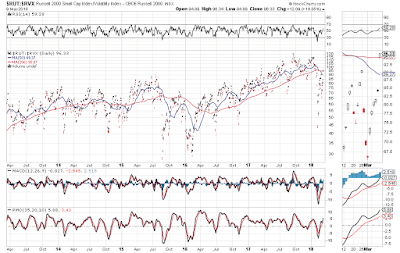
However, they have been battling increased volatility, as depicted on the following three monthly equity/volatility ratio charts (SPX:VIX, NDX:VXN and RUT:RVX).
In my post of February 26, I had re-iterated the importance of, what once were and had been breached, major support levels for these ratios, namely:
- SPX:VIX Ratio -- 200
- NDX:VXN Ratio -- 350
- RUT:RVX Ratio -- 80
The one ratio that is still below that level is the SPX:VIX ratio, but it's poised to break above. Keep an eye on the Momentum indicator for a break and hold above the zero level on this timeframe as confirmation of a resumption of bullish bias in the SPX, if it crosses above 200.
While Momentum on the RUT:RVX ratio is above zero, it's not on the NDX:VXN ratio. It will need to cross and hold above to confirm sustainability of buying in the NDX.

On a daily timeframe, you'll note that all three ratios are still trading under the bearish influence of a moving average Death Cross formation.
The SPX:VIX ratio is retesting the 50-day moving average and remains the weaker of the three ratios, while the NDX:VXN and RUT:RVX ratios closed just above their 200-day moving average on Friday. The RSI, MACD and PMO technical indicators are in positive territory on all three ratios, so look for that to continue to confirm a bullish bias in the SPX, NDX and RUT, in the short term. Ultimately, the Death Cross will need to reverse to a Golden Cross as a bullish confirmation, in the longer term.

In conclusion, keep an eye on price action of the monthly and daily ratios (relative to their respective major support levels, moving average formations, and technical indicators), to gauge the strength and direction of the SPX, NDX, RUT, and equities, in general. If we see those gauges turn and/or remain positive, we'll likely see a 10th year produced in this 9-year bull market run. As well, additional influencers of equity volatility can be found in the "Volatility Gauges" that I described in my post of February 10.


