
7 Social Media Stocks: Buy Or Hype?
Love it or hate it, social media is here to stay. Most of the world is now connected through our phones and computers. We live in a time where politicians, athletes, and celebrities can get a message out to their followers with just a few clicks on their phone.
Social media has changed the way people live.The social media industry has also received a tremendous amount of attention from investors. Are the massive market caps and high valuations in the industry justified, or is this another case of ‘irrational exuberance’?
This article examines several well-known social media companies in an attempt to determine which, if any, are worth investing in.
Snap Inc (SNAP)
Snap has only been in existence since 2011 and has only been a publicly traded company since March 2017. The company is the maker of Snapchat, one of the most popular social networking apps. Snapchat is targeted towards those in the age range of 18 to 24.
Snap released financial results for the third quarter on October 25. Revenue increased 43% to $298 million in the quarter. The last twelve months have seen revenues grow 53% to $1.1 billion. Snap is not yet profitable, as the company is spending capital at a high rate to help grow its user base. The company had an operating loss of $323 million, but this was a $138 million improvement from the third quarter of 2017. Free cash flow registered a loss of $159 million, but this was a $61 million improvement year-over-year.
Snap, like many social media companies, generates revenue from digital advertisements. The more users a social media platform has, the more it can charge for ads.
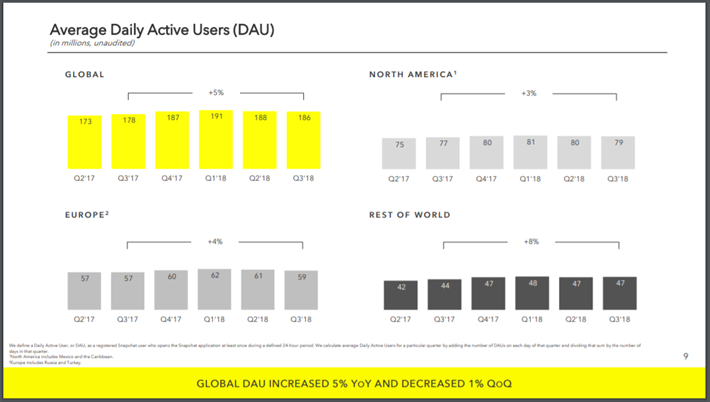
Source: Snap Inc’s Third Quarter Financial Results Presentation, slide 9.
One popular way to measure user engagement for social media companies is through their daily average users, or DAUs. Snap’s DAUs grew 5% year-over-year to 186 million. This was, however, the second sequential decline in DAUs quarterly.
While DAUs in North America and Europe were up 3% and 4%, respectively from the same time period in 2017, they were down from the second quarter of 2018. The rest of the world saw an 8% growth in active users and this region was able to maintain its daily users total compared to the previous quarter.
While the decline in sequential engagement numbers is not ideal, average revenue per user is showing signs of strength.
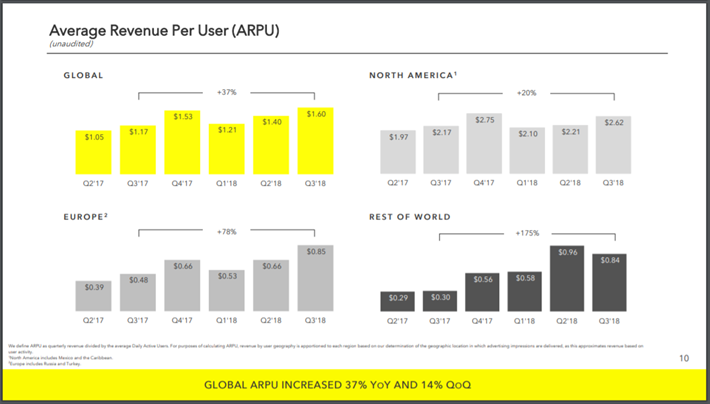
Source: Snap Inc’s Third Quarter Financial Results Presentation, slide 10.
Snap saw a 37% increase in average revenue per user from the third quarter of 2017. On a sequential basis, ARPU grew 14%.North American ARPU, which have accounted for 65%-80% of all revenues since Snap became a public company, saw 20% growth from Q2 2017 and a nearly 19% increase from the previous quarter. European ARPU increased 78% year-over-year and 29% from the previous quarter. The rest of the world, which has represented just a small portion of total sales, saw a 175% increase year-over-year, though sequential ARPU declined almost 13%.
Snap has been able to increase its ARPU while suffering slight declines in daily users. And, as you’ll see, Snap only has a fraction of the number of DAUs that other social media companies have. With a small engagement base, Snap cannot afford to stop growing.
On the positive side, Snap has a very stable daily user base. The reason ARPUs have increased despite declines in DAUs is that 80% of Snap’s users use the app every day, one of the highest rates of engagement among all social media companies. Users outside of North America and Europe largely remain an untapped source of potential users. If the company were to expand aggressively to these markets, they could see an increase in their engagement numbers.
All that said, Snapchat is used by those in a very tight age bracket. If the recent decline in daily active users accelerate, Snap could see its average revenue per user begin to drop as well. The stock has cratered almost 80% from its initial public offering price, but we don’t feel that makes the stock a buy.
Snap is still trading for a price-to-sales (not earnings, sales) ratio of 8.0. Social media industry leader Facebook has a net profit margin of 37.6%. Note that Snap is currently losing money. If Snap were to miraculously become as profitable as Facebook (which is far from likely), the company would be trading for a price-to-earnings ratio of 21.3 today.
Despite massive share price declines, Snap still looks overvalued. Additionally, sequential declines in daily active users show that the company’s massive growth expenditures are not effectively growing the company. We recommend investors avoid Snap until it proves it can grow consistently, be profitable, and trades at a reasonable price-to-earnings ratio.
Twitter (TWTR)
Another young company, Twitter became public on November 7, 2013.Twitter closed its first day of trading at nearly $45 per share. Since becoming public, shares of Twitter have experienced a roller coaster ride. The stock dropped as low as $14 in 2016 and 2017, before rebounding to its current price north of $31. Investors who bought at the on the opening day at its high are still underwater five years later.
Twitter reported third quarter earnings on October 25th. The company earned $0.21 per share, topping expectations by $0.07 and improving 110% from the previous year. Revenue grew 29% to $758 million, beating estimates by $57 million. This was Twitter’s highest ever quarterly revenue total, the company’s third consecutive quarter of 21%+ revenue growth and the highest year-over-year growth since the second quarter of 2016.
Total U.S. revenues grew 32% while international revenue saw a 26% improvement.T witter is truly a global company, with 56% of sales from the U.S. and 44% from international markets. Advertising revenue grew 29% to $650 million, above the market’s expectations of $593 million. Users' engagement with ads increased 50% from the third quarter of 2017 while cost per engagement declined 14%. Data licensing sales were up 25% to $108 million, slightly above what analysts were looking for.
Despite these positives, there are some negative issues investors need to know.
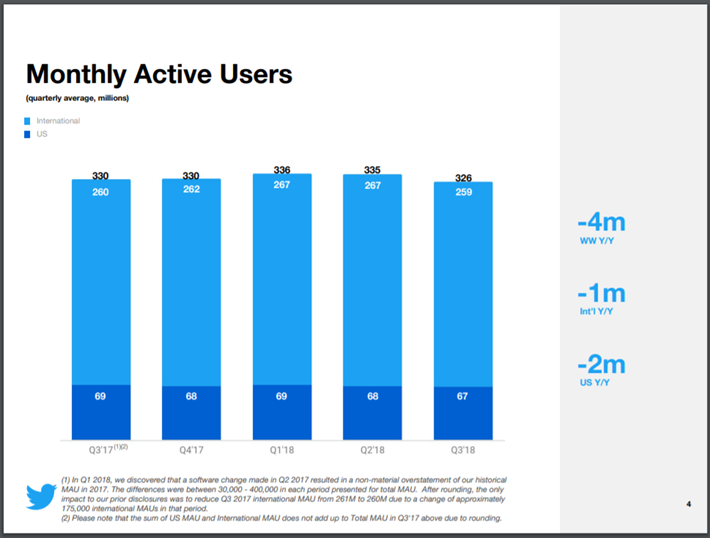
Source: Twitter’s Third Quarter Earnings Presentation, slide 4.
Twitter’s monthly active users count is down four million on a year-over-year basis. In addition, the company has seen a drop in active users from the second quarter of 2018. Monthly users in international markets, the bulk of Twitter’s users, have declined almost 3% sequentially.U.S. monthly users have dropped 1.5%.
As you might guess, the story isn’t much better when you look at daily active users.
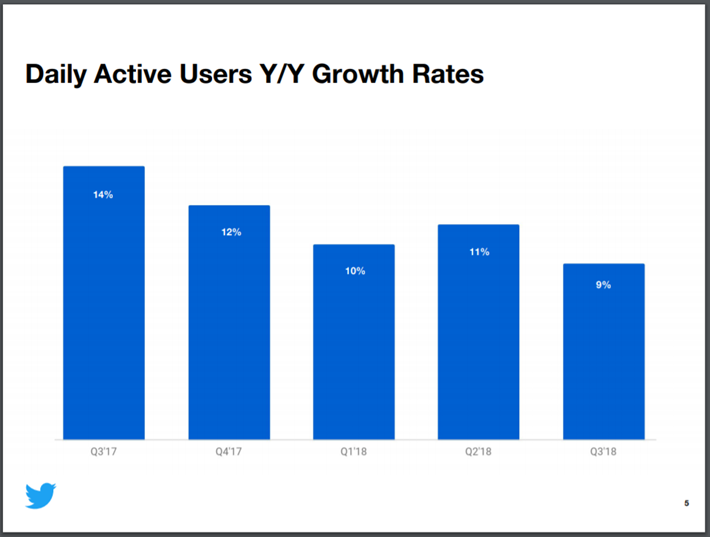
Source: Twitter’s Third Quarter Earnings Presentation, slide 5.
While daily active users have increased 9% from the previous year, this is down from Q3 2017’s growth rate of 14% and below Q2 2018’s growth rate of 11%. While daily users are up, the numbers are not as strong as in previous quarters.
And while ad engagements increase of 50% is impressive on its own, they become less so when you recall that Twitter saw a 99% growth in ad engagements during the same quarter in 2017. Ad engagements grew 81% in the second quarter of 2018, so Twitter’s growth in this category has begun to slow.
The average earnings-per-share estimate for Twitter for the year is $0.80. Based off of the current price of $31.12, Twitter trades with a current multiple of 38.9. Unlike Snap, Twitter is profitable, but much more expensive than the next two social media names on our list.
While Twitter saw record revenue and posted attractive growth rates in both its domestic and international markets, we think investors should avoid buying shares of the company.Given the declines in users, we think paying nearly 39x earnings estimates is far too expensive for Twitter.
Social Media Stock #3: Facebook (FB)
Facebook is the social media industry leader. In the most recent reported quarter, Facebook had nearly 2.3 billion members use their services per month and almost 1.5 billion people accessed Facebook every day. This total dwarfs Snap’s or Twitter’s numbers. This type of user engagement attracts the attention of advertisers in a big way.
Shares of Facebook currently sit at $131.73, a decline of nearly 13% in just the last month and nearly 40% drop from its all-time high on July 26. This drop in price can largely be attributed to self-inflicted wounds as the company has found itself in a variety of scandals.
In March of 2018, it was revealed that Cambridge Analytica, a British political consulting firm, had used data from more than 50 million users without their permission, which was then used by the Trump campaign to target voters during the 2016 presidential election. CEO Mark Zuckerberg testified before Congress later that month in regard to this issue.
In late September and early October, it was revealed that a security breach had impacted 30 million Facebook users, of which 14 million had personal information exposed. Then on November 14, it become public knowledge that Facebook had attempted to control the discussion around its social media network. The company hired an opposition research firm to produce articles criticizing business practices of other large tech firms, such as Apple (AAPL) and Alphabet (GOOGL). In addition, Facebook has seen numerous top executives leave in recent months, including the co-founders of WhatsApp and Instagram.
The bevy of scandals and drain of high ranking talent has weighed on the stock since late July. An earnings miss during the second quarter as well as the company’s statement that revenue growth rates would be below the previous year also contributed to the decline in shares.
It is clear that Facebook has suffered some missteps over the past few months, but is the stock worth considering based on the business fundamentals?
Facebook reported third quarter financial results on October 30. The company earned $1.76 per share, $0.30 above estimates and an improvement of almost 11% year-over-year. Revenue grew 33% to $13.73 billion, but missed estimates by $40 million. This quarter represented Facebook’s lowest revenue growth total since the company went public in May of 2012.
Facebook’s DAUs increased 9% to 1.49 billion, but below expectations of 1.51 billion. Monthly active users improved 10% to 2.27 billion, but this too was slightly below expectations of 2.29 billion. Amazingly, despite the scandals, Facebook’s ratio of DAUs to MAUs has remained stable at 66%.
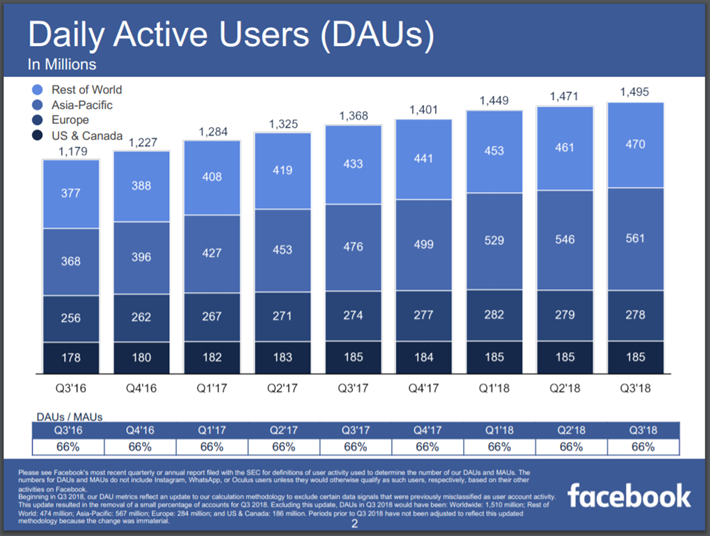
Source: Facebook’s Third Quarter Financial Results Presentation, slide 2.
Revenue per user increased 20% to $6.09. Both DAUs and ARPUs were up slightly sequentially as well. Again, despite the negativity surrounding Facebook, revenue per user in the U.S./Canada region grew 30%, topping growth rates for Europe (29%), Asia-Pacific (17.6%) and the Rest of World (14.4%). Despite the company’s issues, advertisers continue to pay for ads as the company provides them with a large potential customers base.
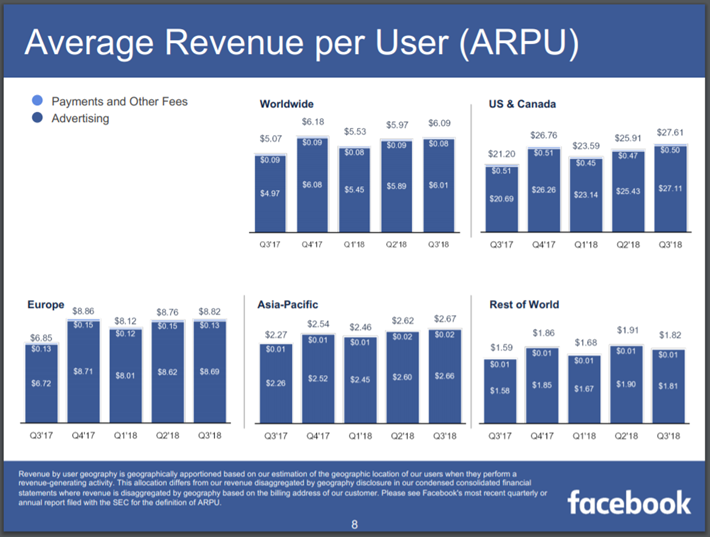
Source: Facebook’s Third Quarter Financial Results Presentation, slide 8.
The 40% decline from its high has brought Facebook’s valuation to a less lofty perch. Based off the 11/23/2018 closing price of $131.73 and the average analysts’ EPS estimate for 2018 of $7.37, Facebook’s stock has a price-to-earnings ratio of 17.9. Value Line says the average P/E ratio over the past five years is nearly 50. Facebook had an average P/E of 25.3 in 2017. For comparison purposes, the S&P 500 has a current P/E of 21.5.
Investors looking for exposure to the social media sector could see Facebook as a ‘growth at a reasonable price’ play. Compared to the valuation of the market as well as its own history, Facebook shares are somewhere between slightly undervalued to dramatically undervalued.
However, we only recommend that investors with a high tolerance for risk purchase shares of Facebook due to the company’s ongoing issues and the slightly lower than anticipated revenue growth, coupled with the fact that the company does not have a long (multi-decade) history of success showing stability.
Yelp (YELP)
Yelp is a local-search service that allows users to log in and rate and review their experiences with local businesses. This service is primarily geared towards restaurants, but can be used for other types of businesses, such as handyman and repair services. Users can access the website and rate their experiences at a local business and write reviews. Other users can then read the reviews and use them to influence their decision about using these businesses.
Yelp is a very popular search service, averaging thirty-four million unique visitors to their app and seventy-five million visits through the website during the most recent quarter. Reviewers left more than 171 million reviews as well.
Yelp reported third quarter financial results on November 8.
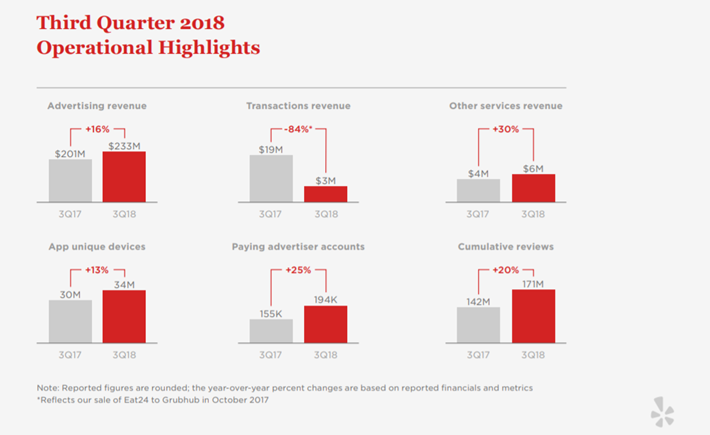
Source: Yelp’s Third Quarter Financial Results Press Release.
Earnings-per-share nearly doubled year-over-year to $0.17. This beat analysts’ estimates by $0.07. Revenue grew 8% to $241.1 million, though this was $4.3 million below what analysts were looking for. Adjusted EBITDA of $50.3 million was a $7 million increase from the previous year, but was below estimates for $51.4 million.
A major factor in the lower than expected results is that Yelp recently has instituted a no initial term commitment for advertisers. This allows advertisers to pull their ads if they feel they aren’t generating a solid return on their investment. Since the start of the year, this has led to a 60% increase in new advertisers, a growth rate that Yelp hasn’t seen since inception. While this could be a long term positive for Yelp, it can also lead to more volatile revenue growth in the short term, as was the case during the third quarter. The miss in revenues and adjusted EBITDA led to a 30% decline in shares of Yelp following the results release.
On the positive side, advertising revenues grew 16% during the quarter while unique app visitors increased 13%. Reviews increased 20% from the third quarter of 2017. Operating cash flow was $116 million for the first nine month and Yelp has nearly $840 million in cash and equivalents.Y elp repurchased 160K shares during the third quarter at an average price of $37.50.
Yelp currently trades at $32. The company is expected to earn $0.37 per share this year, giving the stock a P/E of 86.5. This is one of the highest valuations on our list of social media companies. Due to the uncertainty regarding Yelp’s no term advertising on revenues in the near term and the sky-high valuation, we encourage investors to avoid the stock.
Weibo Corporation (WB)
Launched in 2009 by Sina, Weibo is the largest social media platform in China. Chinese citizens do not have access to other forms of social media like Facebook and Twitter as the government tries to control the flow of information. This allows Weibo to avoid U.S. competition in the social media sector in China.
Key opinion leaders, or KOLs, build following among fans and then monetize their image through advertisements, online sales, and paid subscriptions. KOLs are internet celebrities that have mass appeal among China’s younger generations. Weibo KOL come from industries such as movie celebrities, media outlets and government agencies. Weibo works with these internet celebrities to help them refine their product to improve their quality of content. Higher production values can lead to more subscribers and increased advertisement dollars.
Weibo combines elements of other social media platforms, such as Instagram and YouTube, in hopes of attracting viewers. Users can upload videos as well as perform live broadcasts. The company has done well at increasing the number of advertisements. For example, third party revenue doubled in 2016.
Weibo reported third quarter results on November 28.
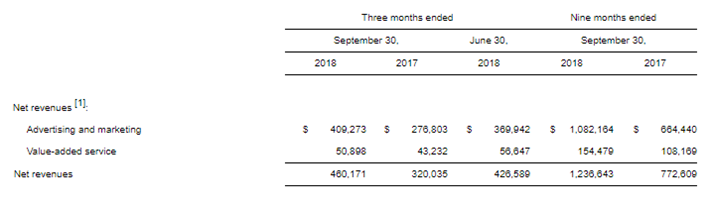
Source: Weibo’s Third Quarter Financial Release.
The company earned $0.75 per share, $0.05 above the average estimate. This was a 47% increase from the third quarter of last year. Revenue grew 44% to $460.17 million, beating estimates by $1.85 million. While the revenue growth rate is impressive, this is actually the lowest year-over-year increase since the fourth quarter of 2017.
Advertising and marketing revenues increased 48% to $409.3 million. Value-added service saw 18% growth to $50.9 million. Adjusted EBITDA was nearly $193 million, representing growth of 42% from the same quarter of last year.
Average daily users increased 18.2% to 195 million while monthly active users improved 18.6% to 446 million. Approximately 44% of Weibo’s monthly user base access the social media platform each day. 93% of monthly active users use Weibo through their mobile phones, which gives advertisers a sizable digital market for which to place their ads. The company expects fourth quarter revenue to be in a range of $480-$490 million, below consensus of $498 million. Shares were up nearly 5% after the results release.
Shares of Weibo were worth almost $140 as recently as last February. Since then, shares have declined 56% to the current price of $62. The average analyst's estimate for earnings-per-share for this year is $2.65. This results in a P/E ratio of 23.4. This ratio is on the lower end of all the social media companies discussed in this article.
Weibo has done well at monetizing its business as evident by high rates of growth in recent years. There are 413 million people in China under the age of 24 .This represents 30% of the population of the country. This gives Weibo a potentially enormous future user base to pull from. Weibo’s average monthly users represent a little more than 1% of China’s under 24 age group.
If Weibo is able to continue to grow its user base and drive more traffic, it will be able to demand more in advertisement fees. Without competition from some of the largest social media platforms in the world, Weibo stands poised to see sustained growth going forward. We believe that investors looking for access to China could consider adding Weibo to their portfolio.
Alphabet, Inc
Alphabet, better known as Google (GOOGL), is one of two companies on this list (the other being Microsoft) whose main business isn’t directly related to social media platforms, but that doesn’t mean investors looking for exposure to this space shouldn’t consider owning the stock.
Google is a player in the social media industry through Google+, although advertising revenue from search is the company’s main revenue generator.
It is estimated that Google maintains an 80% share in the online search market. Whether it’s looking for research material on the internet, directions to new restaurants to try, vacation ideas or searching for information on practically any topic, people often head to google.com first. There is a reason that “Google it” has become a mainstream phrase. This ability to control so much of the search market has made Google so important around the world.
The company does contain divisions that can be considered more social media like than search. Google’s YouTube.com continues to be a place where people turn to learn new skills such as cooking or how to fix a leaky faucet. Viewers can also view video and music clips from YouTube as well.Google’s email service Gmail is also one of the most popular email services.
Within Gmail, people can connect to each other through Google+ and have video and teleconferences for business meetings, conference calls and fantasy football drafts as well as video chat with friends and family. The Google Assistant is becoming more popular among consumers and can now speak 20 languages. Google is also investing in Waymo, the company’s autonomous connected car business, which could generate billions in the next decade or two.
Google reported third quarter financial results on October 25.
Source: Alphabet’s Third Quarter Financial Results
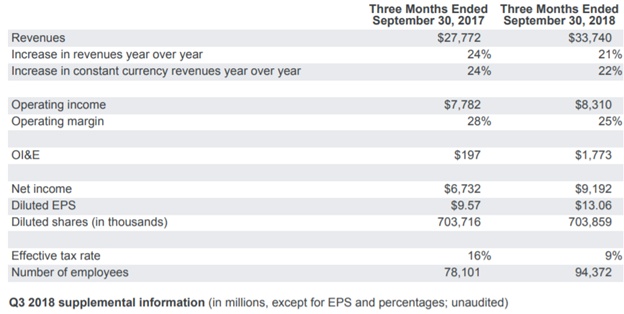
Google earned $13.06 per share, topping the average analysts’ estimate by $2.65 and growing 36% from the same quarter a year ago. Revenue grew 22% to $33.74 billion, but was $310 million below expectations. A lower effective tax rate (9% compared to 16% for Q3 2017) aided the bottom line. Currency negatively impacted results by more than $300 million.
Sales in both the U.S. ($15.5 billion) and Europe Middle East Africa ($11 billion) grew by 20%. The Asia Pacific China geography saw revenues grow 29% to $5.4 billion versus the previous year. Google saw operating expenses grow 26% to $11.1 billion due to a higher employee headcount and investments in various business segments. The majority of new hires were for technical and sales roles as Google is investing in people to help grow its business. Operating cash flow was nearly $8 billion in the quarter.Google had nearly $120 billion in cash on its balance sheet at the end of the quarter.
Search revenues grew 22% to $24 billion, led by gains in mobile search. YouTube was a major contributor to sales growth in this area. Network sales grew 14% to $4.9 billion as mobile advertisements continue to be strong for the company. Google’s Cloud business helped Other revenues increase nearly 30% increase. Cloud business is expected to increase dramatically over the next decade. Google’s growth and hiring in this area has the company positioned to take advantage of the growth in demand for cloud computing.
Google is expected to earn $41.74 per share in 2018. Based off of the most recent share price of $1030, Google’s stock trades with a price-to-earnings ratio of 24.7. This is only slight above Value Line’s ten-year average P/E of 23.9 for the stock. The stock is only slightly overvalued when compared to the S&P 500 index (21.5).
Google’s business is not primarily in the social media industry, so it doesn’t make a good choice for investors looking for social media specific exposure. But, the company appears reasonably valued given its extremely strong competitive advantage and solid growth prospects. It isn’t a bargain right now, but is certainly a hold at current prices.
Microsoft (MSFT)
As with Google, Microsoft’s core business is not in the social media industry.
But, on June 13th, 2016, Microsoft agreed to purchase LinkedIn for $26.2 billion. LinkedIn is a social networking site designed for the business community. Members of this service can showcase their skills, provide employment history and state their education level. This service allows members to establish a network among professionals. LinkedIn allows human resource managers to attract and retain the best talent for their positions .LinkedIn has been in existence since 2003 and has more than 300 million members spread out over 170 different industries.
Microsoft reported financial results for first quarter of fiscal 2019 on October 24. LinkedIn results were impressive.
LinkedIn revenues soared 33% on the strength of 34% growth in levels of engagement in LinkedIn sessions. This was a quarterly record for messages sent, content shared among members, and job postings. Aiding this increase in connectivity is the ability of members to connect directly with LinkedIn services from Microsoft 365. This network has become a very valuable asset to the company and should help grow revenues and earnings well into the future.
The rest of Microsoft’s first quarter was strong as well.
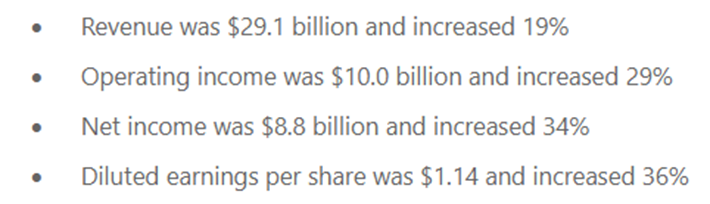
Source: Microsoft’s First Quarter Financial Results Press Release.
Microsoft earned $1.14 per share during the quarter, beating the market’s expectations by $0.20 and improving 36% from the first quarter of fiscal 2018. Revenue grew almost 19% to $29 billion, coming in ahead of estimates by $1.2 billion.
Productivity & Business Processes, which houses Office 365 and cloud services, saw revenue increase 18% in constant currency to $9.8 billion. Office commercial products grew 16%, led by a 36% gain in Office 365 sales.
The Intelligent Cloud division posted 24% growth as revenues for servers and cloud services increased 28%. Revenue for Azure grew 76%, though this was below previous quarterly growth rates of more than 90%.
Personal Computing sales climbed 15%. Windows commercial products and services saw 12% sales growth. Gaming revenue was 45% higher year-over-year as demand for Xbox software and services was strong. Microsoft’s Surface tablet saw higher volumes, leading to 14% increase in revenues. Search advertising was also solid, growing 17%.
One advantage Microsoft has over other social media stocks is that the company is a dividend payer. No other name on our list can say that. Microsoft has increased its dividend for seventeen consecutive years.The company has increased its dividend:
- By an average of 11.4% over the past three years.
- By an average of 13.9% over the past five years.
- By an average of 14.5% over the past ten years.
Most recently, the company raised its dividend 9.5% for the upcoming December 13th payment. Shares currently yield 1.7%, slightly below that of the S&P 500.
Microsoft’s stock recently closed at $106.47. Based off of expected fiscal 2019 earnings-per-share of $4.25, the stock has a P/E of 25.1. For comparison, shares have a ten-year average P/E of 15.2 and a five-year average P/E of 18.9.
Even so, we feel that Microsoft has earned an elevated valuation due to the fundamentals of its business. The company posted gains across almost all divisions of its business and has seen in high growth rates in LinkedIn, Azure and gaming to name a few. Microsoft’s dividend, while not extraordinarily high, does offer investors a decent stream of income and double digit dividend growth.
Microsoft shouldn’t be investors first choice when looking for social media exposure. While the company’s current price-to-earnings ratio is well ahead of its historical average, Microsoft has done very well since current CEO Satya Nadella took over the company in 2014.We view Microsoft as a hold at current prices.
Final Thoughts
Of the seven companies analyzed in this article, Microsoft and Google only have limited exposure to the social media industry. While phenomenal businesses in their own right, they shouldn’t be potential social media investor’s first option due to their diversified business models which limit their social media exposure.
Snap, Twitter, and Yelp all appear overvalued currently. Additionally, all three have lingering concerns about slowing growth or unpredictability.
That leaves Weibo and Facebook. While international investing comes with additional risks, we rate Weibo as our second choice for social media exposure based on the company’s somewhat reasonable valuation and exceptionally strong growth prospects.
Our top choice for social media exposure is Facebook. The company’s price-to-earnings ratio is under 20, it has proven its monetization abilities, and is the gold standard in the social media industry.
Disclaimer: Sure Dividend is published as an information service. It includes opinions as to buying, selling and holding various stocks and other securities. However, the publishers of Sure ...
more

