
5 Stocks To Own Regardless Of The Election
What will happen to the stock market immediately following the election is as unknown today as the election results themselves.
As results came in on election night in 2016, Dow futures fell 900 points before the Dow rallied to near all-time highs the following day. To protect themselves from such huge potential volatility, investors’ should put their money in quality companies that are positioned to survive any short-term volatility and have upside potential over the long-term.
Navigate Volatility With Best-in-Class Firms
We think these five stocks offer excellent risk/reward across nearly any election outcome. The Hershey Company (HSY: $144/share), D.R. Horton (DHI: $71/share), Simon Property Group (SPG: $65/share), JPMorgan Chase & Company (JPM: $101/share), and Allstate Corp (ALL: $91/share) are this week’s Long Ideas. See Figure 1.
These firms, previously featured in our See Through The Dip reports, have strong balance sheets to withstand difficult economic conditions and valuations with great upside should the economy recover to pre-COVID levels. Furthermore, we expect these companies will not just survive the ongoing economic downturn, but will also gain market share lost by companies who do not survive. In other words, these stocks have lots of downside protection with strong upside potential.
Figure 1: Five Stocks to Own Regardless of the Election
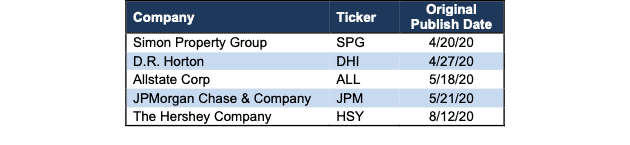
Sources: New Constructs, LLC and company filings.
These companies are best-in-class in their respective markets, and they share the following:
- Attractive-or-better risk/reward stock rating
- Large cash reserves to survive a prolonged economic downturn
- Superior and/or faster rising return on invested capital (ROIC) compared to peers
- Strong market share and competitive position
- Not dependent, in any meaningful way, on election results
Investors looking for long-term-value-creating stocks leading up to the election should start here.
The Hershey Company (HSY: $143/share) – Attractive Rating
We made The Hershey Company a Long Idea on August 12, 2020. Since then, the stock is down 4% while the SP 500 is down 2%. Despite this slight underperformance, HSY still presents excellent risk/reward for investors especially in light of the upcoming election.
The Hershey Company offers investors several competitive advantages that are not affected by which political party is in power. Some of these advantages include:
- Superior distribution network that drives future growth
- Innovative products that capture consumers’ changing needs
- Large secular growth tailwind of increased snacking
Many investors are disappointed with Hershey’s performance since the onset of the pandemic. Even though consumers are purchasing the firm’s products more frequently, international and travel retail weakness have slowed sales. In fact, the firm’s TTM revenue of $7.9 billion is below the $8 billion the firm generated in 2019. For reference, over the past 22 years, the firm has generated lower year-over-year revenue just three times.
These short-term issues, however, are more than offset by the firm’s long-term positioning to become a “snacking powerhouse.” After making several strategic acquisitions, the firm’s existing geographical footprint allows Hershey to effectively expand its “better-for-you” snacks into new markets.
With a broader range of snacks now available, The Hershey Company is well-positioned to take advantage of the long-term secular trend of more people snacking more frequently. In 2019, the percent of consumers that snacked three or more times a day equaled 47%, up from 43% in 2015. Additionally, Mordor Intelligence expects the global candy industry to grow by 4% compounded annually through 2024.
No matter the election’s outcome, these advantages will remain in The Hershey Company’s favor over the long term.
HSY Trades Below Its Economic Book Value
Despite rebounding from its March lows, at $142/share, HSY trades below its economic book value, or no-growth value, for the first time since 2015. At a price-to-economic book value (PEBV) ratio of 0.9, the market expects The Hershey Company’s NOPAT to permanently decline by 10%. This expectation seems overly pessimistic over the long term. For reference, The Hershey Company has grown NOPAT by 7% compounded annually over the past two decades.
The Hershey Company’s current economic book value is $151/share – a 6% upside to the current price.
Current Price Implies Prolonged Business Downturn
Below, we use our reverse DCF model to quantify the cash flow expectations baked into The Hershey Company’s current stock price.
In this scenario, we assume:
- NOPAT margin falls to 11% (average from 2007-2009) in 2020 and rises to 15% (five-year average, compared to 21% TTM) in 2021 and each year thereafter
- Revenue falls 5% in 2020 (well below consensus estimates for -0.5% revenue decline) in 2020 and does not grow until 2023
- Sales begin growing again in 2023, but only at 3% a year, which is below the average global GDP growth rate since 1961 (3.5%)
In this scenario, The Hershey Company’s NOPAT grows by less than 1% compounded annually over the next decade (including a 36% YoY drop in 2020) and the stock is worth $143/share today – equal to the current price. See the math behind this reverse DCF scenario.
For comparison, The Hershey Company grew NOPAT by 8% compounded annually over the past decade and 7% compounded annually over the past two decades. It’s not often investors get the opportunity to buy a strong firm in a growing industry at such a discounted price.
Figure 2 compares the firm’s implied future 10-year NOPAT CAGR in this scenario to its historical NOPAT CAGR over the previous 10 years.
Figure 2: Prior Decade’s NOPAT CAGR vs. Implied Future 10-Year CAGR
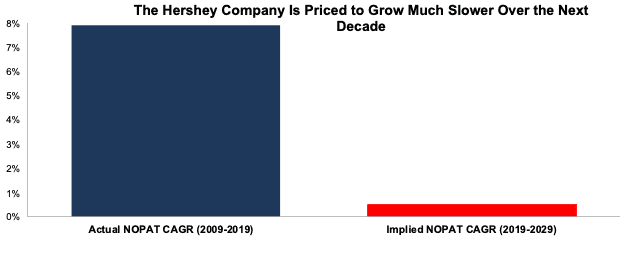
Sources: New Constructs, LLC and company filings.
Moderate Long-Term Recovery Could Be Very Profitable
If we assume, as does the International Monetary Fund (IMF) and many other economists in the world, that the global economy rebounds and returns to growth starting in 2021, HSY is undervalued.
In this scenario, we assume:
- NOPAT margin falls to 15% (five-year average) in 2020-2024 and rises to 18% (below TTM of 21%) in 2025 and each year thereafter
- Revenue falls 0.1% in 2020, grows 2.7% in 2021 and 2% in 2022 (consensus estimates)
- Revenue grows by 3% a year in 2023 and each year thereafter, which is slightly below the average global GDP growth rate since 1961
In this scenario, The Hershey Company’s NOPAT only grows by 3% compounded annually over the next decade (including a 12% YoY drop in 2020) and the stock is worth $190/share today – a 34% upside to the current price. See the math behind this reverse DCF scenario.
Figure 3 compares the firm’s implied future NOPAT in this scenario to its historical NOPAT.
Figure 3: Implied Profits Assuming Moderate Economic Recovery
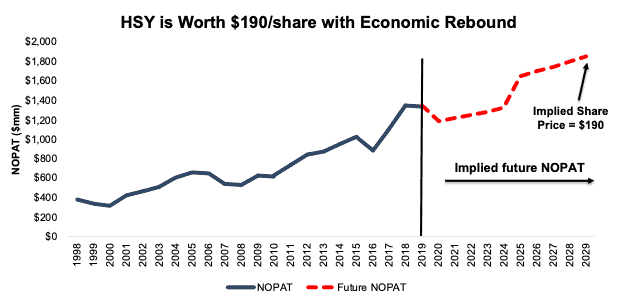
Sources: New Constructs, LLC and company filings.
D.R. Horton (DHI: $69/share) – Very Attractive Rating
Read our previous report here: Rebuild Your Post-COVID Portfolio with This Industry Leader.
We made D.R. Horton a Long Idea on April 27, 2020. Since then, the stock is up 64% while the SP 500 is up 15%. Even with these nice gains, DHI continues to present excellent risk/reward for investors after election season.
No matter the election outcome, we do not see the demand for new housing changing in the near future. In fact, housing demand across the country will continue to be a strong tailwind for the home construction industry.
D.R. Horton has several competitive advantages, coupled with favorable macro-trends that are not affected by which political party is in power. Some of these include:
- Economies of scale
- Historically low housing supply levels
- Over two-decade record of gaining market share
- Focus on serving in-demand price points of $300K or lower
D.R. Horton is able to leverage its economies of scale across the homebuilding industry to drive a superior return on invested capital (ROIC). Over the TTM, the firm’s ROIC of 11% is superior to the two other largest builders PulteGroup Inc. (PHM) and Lennar Corporation (LEN).
This superior profitability has driven market share gains for the firm for over two decades. Despite the many oscillations within the number of houses sold across the U.S. during this time, D.R. Horton has managed to improve its market share from less than 1% in 1994 to 8% in 2019.
D.R. Horton is positioned to keep gaining market share, too. Over 2/3’s of the firm’s revenue in 2019 came from inventory priced at $300K or lower. D.R. Horton has successfully been filling the need in this underserved segment of the housing market nationwide and is situated to continue to do so no matter which political party wins.
DHI Trades at Cheapest Level in Years
Despite strong fundamentals and industry tailwinds, DHI still trades significantly below its economic book value and at its cheapest level since 2014. At its current price of $69/share, DHI has a PEBV ratio of 0.8. This ratio means the market expects DHI’s NOPAT to permanently decline by 20%. This expectation seems overly pessimistic over the long term for a firm that has grown NOPAT by 11% compounded annually over the past two decades.
DHI’s current economic book value, or no-growth value, is $88/share – a 28% upside to the current price.
Current Price Means Slow NOPAT Growth Over the Next Decade
If we assume D.R. Horton grows revenue well-below consensus estimates and use the firm’s historical margins, and average historical GDP growth rates, we can model the worst-case scenario already implied by DHI’s current stock price. In this scenario, we assume:
- NOPAT margin falls to 8% (company 10-year average compared to 10% TTM)
- Revenue falls 17% in 2020 (vs. consensus estimate of +12%)
- Sales begin growing again in 2021, but only at 3.5% a year, which equals the average global GDP growth rate since 1961
In this scenario, where DHI’s NOPAT grows by less than 1% compounded annually over the next decade (including a 26% YoY decline in 2020), the stock is worth $69/share today – equal to the current stock price. See the math behind this reverse DCF scenario.
For reference, DHI’s NOPAT declined by 26% compounded annually from 2007 to 2011 before growing by 35% compounded annually the next six years.
Figure 4 compares the firm’s implied future 10-year NOPAT CAGR in this scenario to its historical NOPAT CAGR over the previous 10 years.
Figure 4: Prior Decade’s NOPAT CAGR vs. Implied Future 10-Year CAGR
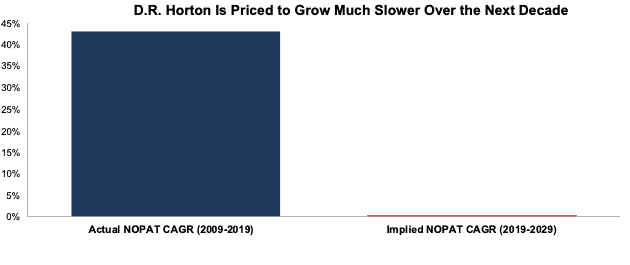
Sources: New Constructs, LLC and company filings.
Cheap Valuation Provides Significant Upside
If we assume that D.R. Horton’s revenue grows in-line with consensus estimates, DHI looks even more undervalued.
In this scenario, we assume:
- NOPAT margin falls to 9% (three-year company average compared to 10% TTM)
- Revenue grows 12% in 2020, 17% in 2021, and 6% in 2022 (consensus estimates)
- Sales continue to grow at 3.5% a year, or the average global GDP growth rate since 1961, each year thereafter
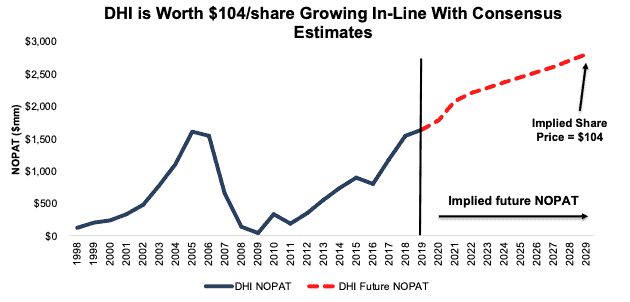
In this scenario, DHI’s NOPAT grows by under 6% compounded annually over the next decade, and the stock is worth $104/share today – a 46% upside to the current price. See the math behind this reverse DCF scenario.
For comparison, DHI has grown NOPAT by 17% compounded annually over the past five years.
Figure 5 compares the firm’s implied future NOPAT in this scenario to its historical NOPAT.
Figure 5: Implied Profits Assuming Moderate Revenue Growth
Sources: New Constructs, LLC and company filings.
Simon Property Group (SPG: $62/share) – Attractive rating
We made Simon Property Group a Long Idea on April 20, 2020. Since then, the stock is up 12% (S&P 500 +17%). While the stock has underperformed slightly, the underlying fundamentals of the business mean the stock has plenty of upside potential.
One of the biggest casualties of the COVID-19-induced economic slowdown has been brick and mortar retailers. Even before the pandemic, brick and mortar stores were trying to fight off increased competition from Amazon (AMZN) and other ecommerce retailers. Unfortunately, an inability to adequately adjust to a changing world put many out of business for good.
With all the doom and gloom around brick and mortar and the increased strain from COVID-19-related shutdowns, SPG’s shares are down 56% year-to-date (YTD). But investors should be wary of throwing the baby out with the bathwater. The retailers that survive, such as Williams-Sonoma (WSM), will do so stronger than ever, with less competition, and better equipped to compete against ecommerce giants like Amazon.
Simon Property Group has a high-quality portfolio of such retailers that has consistently delivered high returns and is the most profitable mall REIT among its peers. Even in the challenging retail environment of the last several years, the firm’s sales per square foot has risen from $603 in 2012 to $693 in 2019. Simon Property Group’s below average vacancy rate helps the firm improve its sales per square foot. Simon Property Group’s 4.9% vacancy rate in 2019 was nearly half the U.S. mall vacancy rate of 9.7%.
Furthermore, Simon Property Group can explore options with its properties beyond traditional retail. Amazon and Simon Property Group have already been in talks about potential collaboration, which indicates that the retail behemoth sees the value in the firm’s assets.
Simon Property Group’s quality assets give the firm long-term upside that will be largely unaffected by short-term election results.
SPG Has Lots of Upside Potential
At its current price of $62/share, SPG has a PEBV ratio of 0.5. This means the market expects Simon Property Group’s NOPAT to permanently decline by 50%. This expectation seems extremely pessimistic and shortsighted. For reference, Simon Property Group’s NOPAT fell just 12% year-over-year (YoY) in 2009 and then grew nearly 37% YoY in 2010, which put profits at a then all-time high.
SPG’s current economic book value is $125/share – a 102% upside to the current price.
SPG Is Priced for Permanent NOPAT Decline
Below we use our reverse DCF model to quantify the cash flow expectations baked into SPG’s current stock price. In this scenario, we assume:
- NOPAT margin falls to 4% from 2020 to 2023 (vs. 10% TTM) – in line with company average from 2007 to 2011 – and increases to 8% (company 10-year average) thereafter
- Revenue falls 36% in 2020 (more than double consensus estimate decline of 17%)
- Sales begin growing again in 2021, but only at 3% a year, which is below the average global GDP growth rate since 1961
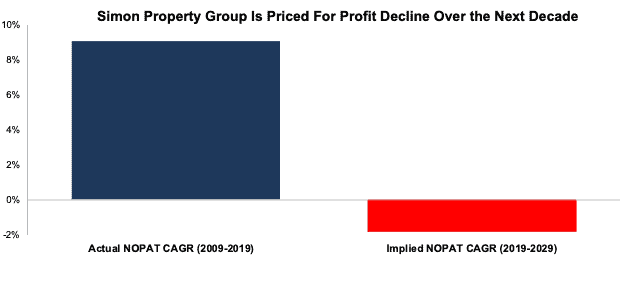
In this scenario, where Simon Property Group’s NOPAT declines 2% compounded annually over the next decade (including a 36% YoY decline in 2020), the stock is worth $62/share today – equal to the current stock price. See the math behind this reverse DCF scenario.
Figure 6 compares the firm’s implied future 10-year NOPAT CAGR in this scenario to its historical NOPAT CAGR over the previous 10 years.
Figure 6: Prior Decade’s NOPAT CAGR vs. Implied Future 10-Year CAGR
Sources: New Constructs, LLC and company filings.
Small NOPAT Growth Means Huge Upside
If we assume that the global economy rebounds and returns to growth starting in 2021, SPG is undervalued.
In this scenario, we assume:
- NOPAT margin remains at 58% (equal to 2019)
- Revenue falls 25% in 2020 (vs. consensus of -17%)
- Sales growth returns in 2021 at 4% per year, which equals SPG’s revenue CAGR over the past decade
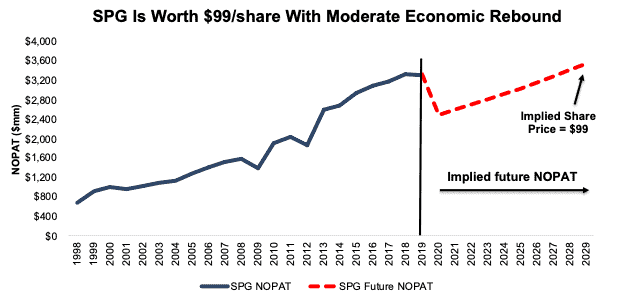
In this scenario, where Simon Property Group’s NOPAT grows just 1% compounded annually over the next decade (including a 25% drop in 2020), the stock is worth $99/share today – a 60% upside to the current price. See the math behind this reverse DCF scenario.
Figure 7 compares the firm’s implied future NOPAT in this scenario to its historical NOPAT.
Figure 7: Implied Profits Assuming Moderate Recovery
Sources: New Constructs, LLC and company filings
JPMorgan Chase & Company (JPM: $99/share) – Very Attractive Rating
We made JPMorgan a Long Idea on May 21, 2020. Since then, the stock is up 7% while the S&P 500 is up 12%. We believe a future economic recovery presents a great opportunity for this stock to outperform the S&P 500 going forward.
This election will not change JPMorgan’s core competitive strengths:
- Strong balance sheet
- Ability to grow profits in a low and falling interest rate environment
JPMorgan has plenty of liquidity to navigate current economic challenges. The firm’s Comprehensive Capital Analysis and Review (stress test) results for 2020 that it submitted to the Federal Reserve assumed a decline in 2020 revenue of 20%. In comparison, consensus estimates expect the firm’s 2020 revenue to actually grow 2%. Furthermore, because of its size, JPMorgan is one of the global systemically important banks (GSIB), which means it is required to meet an even higher capital standard than its smaller counterparts.
Unlike 2008, where the banking industry was at the root of many economic problems, JPMorgan has played a key role in ushering in a recovery during the pandemic. Clearly, JPMorgan is handling the current economic situation from a position of strength.
One of the biggest fears weighing down bank stocks are diminished profitability prospects from a low-interest rate environment. However, JPMorgan has significantly mitigated this risk. Over half of the firm’s revenue consists of noninterest revenue. JPMorgan has a history of growing profits in the face of lower interest rates as well. The Federal Funds Rate fell from 4.68% in 1998 to 0.25% today. Over that same period of time, JPMorgan grew NOPAT from $3.8 billion to $39.1 billion.
No matter which party gains control this election, we believe JPMorgan’s strong balance sheet and ability to grow profits over the long term will remain largely unaffected.
JPM Trades at a Discount
Despite entering the current crisis from a position of strength, JPM is down 26% YTD and now trades at its cheapest PEBV ratio (0.6) since 2012, and nearly equal to 2009. This ratio means the market expects JPMorgan’s NOPAT to permanently decline by 40%. This expectation seems overly pessimistic over the long term.
JPMorgan’s current economic book value, or no-growth value, is $182/share – an 84% upside to the current price.
Current Price Means Profits Decline Long Term
Below, we use our dynamic DCF model to quantify the cash flow expectations baked into JPMorgan’s current stock price.
Using recent projections for revenue declines, historical margins, and average historical GDP growth rates, we can model the worst-case scenario already implied by JPMorgan’s current stock price. In this scenario, we assume:
- NOPAT margin falls to 12% (equal to 2008 and lowest in the history of our model vs. 25% TTM) from 2020-2023 before rebounding to 21% (company average since 2009) in 2024 and each year thereafter
- Revenue falls 1% compounded annually from 2020-2022 (vs. consensus +2.5%, -4.6%, and +1.4%)
- Revenue grows 3% in 2023 and each year thereafter, which is below the average global GDP growth rate of 3.5% since 1961
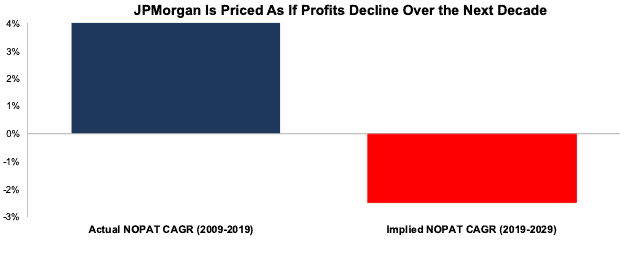
In this scenario, where JPMorgan’s NOPAT declines 3% compounded annually over the next decade (including a 56% YoY decline in 2020), the stock is worth $99/share today – equal to the current stock price. See the math behind this reverse DCF scenario.
Figure 8 compares the firm’s implied future 10-year NOPAT CAGR in this scenario to its historical NOPAT CAGR over the previous 10 years.
Figure 8: Prior Decade’s NOPAT CAGR vs. Implied Future 10-Year CAGR
Sources: New Constructs, LLC and company filings.
Small Recovery Offers Large Upside Potential
If we assume the global economy rebounds and returns to growth starting in 2021, JPM is highly undervalued.
In this scenario, we assume:
- NOPAT margin falls to 12% (equal to 2008 and lowest in the history of our model vs. 25% TTM) from 2020-2021 before rebounding to 21% (ten-year average) in 2022 and each year thereafter
- Revenue grows in line with consensus estimates at +2.5% in 2020, -4.6% in 2021, and +1.4% in 2022
- Revenue grows 3.5% in 2023 and each year thereafter, which equals the average global GDP growth rate since 1961
In this scenario, where JPMorgan’s NOPAT grows less than 1% compounded annually over the next decade, the stock is worth $142/share today – a 43% upside to the current price. See the math behind this reverse DCF scenario.
For comparison, JPMorgan has grown NOPAT 10% compounded annually over the past two decades. It’s not often investors get the opportunity to buy an industry leader at such a discounted price.
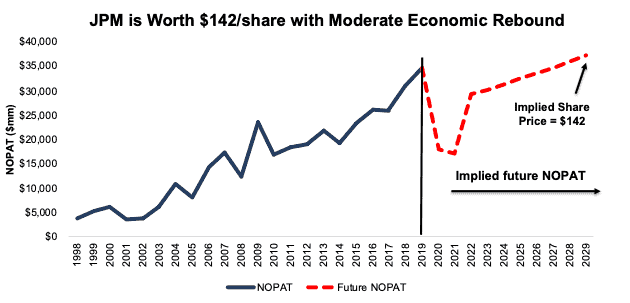
Figure 9 compares the firm’s implied future NOPAT in this scenario to its historical NOPAT. This scenario implies that ten years from now, the firm’s NOPAT will be just 7% higher than its 2019 level. If the firm’s profits grow any faster, JPM has even more upside potential.
Figure 9: Implied Profits Assuming Moderate Recovery
Sources: New Constructs, LLC and company filings
Allstate Corp (ALL: $89/share) – Very Attractive rating
Read our previous report here: Give Your Portfolio Some Insurance with This Industry Leader.
We made Allstate Corp a Long Idea on May 18, 2020. Since then, the stock is down 11% while the S&P 500 is up 12%. Given that the underlying fundamentals of this firm remain strong, the lower price means that this stock offers even better risk/reward now.
No matter the outcome of the upcoming election, the property and casualty insurance industry will remain relatively unaffected. As a best-in-class insurer trading at a big discount, ALL offers lots of upside. Two key factors that make Allstate a great pre-election choice are:
- Disciplined underwriting
- Long-term demand for auto insurance
Allstate utilizes its decade’s worth of data to intelligently asses the risk of its customers. Allstate’s combined ratio, a measure of the amount an insurer pays on claims compared to the amount it receives from premiums, has fallen from 96.2 in 2009 to 89.8 in 2Q20. Simply put, the firm’s disciplined approach to underwriting is driving profitability.
Even in the midst of lesser automobile demand due to the pandemic, Allstate’s TTM revenue is less than 1% below its 2019 revenue. The need for insurance, particularly auto insurance, will persist no matter who wins or loses the election. Bloomberg New Energy Finance estimates that the global vehicle fleet will grow from 1.2 billion in 2020 to 1.4 billion in 2030. The long-term need for car insurance will not simply evaporate based on election results.
ALL Trades at Cheapest Level Since 2012
After falling 20% YTD to $89/share, ALL now trades at its cheapest price-to-economic book value (PEBV), 0.3, in the history of our model. This ratio means the market expects Allstate’s NOPAT to permanently decline by 70%. This expectation seems overly pessimistic over the long term.
ALL’s current economic book value, or no-growth value, is $294/share – a 230% upside to the current price.
Current Price Means Large Profit Decline
Below, we use our reverse DCF model to quantify the cash flow expectations baked into Allstate’s current stock price. Then, we analyze the implied value of the stock based on different assumptions about Allstate’s future growth in cash flows.
Using revenue growth assumptions and historical margins, we can model the worst-case scenario already implied by Allstate’s current stock price. In this scenario, we assume:
- NOPAT margin falls to -6% (all-time company low in 2008) in 2020 before rebounding to 3% (company low excluding 2008) in 2021-2024 and to 6% (10-year average) in 2025 and each year thereafter
- Revenue falls 5% compounded annually from 2020-2024 (vs. consensus estimates of +4% in 2020 and +9% in 2021) and doesn’t grow again until 2025
- Revenue begins growing again in 2025, but only at 3% a year, which equals Allstate’s revenue CAGR over the past decade
In this scenario, Allstate’s NOPAT declines 2% compounded annually (including 158% YoY in 2020) over the next 13 years, the stock is worth $89/share today – equal to the current stock price. See the math behind this reverse DCF scenario.
This scenario represents a truly worst case to illustrate the pessimistic expectations baked into ALL.
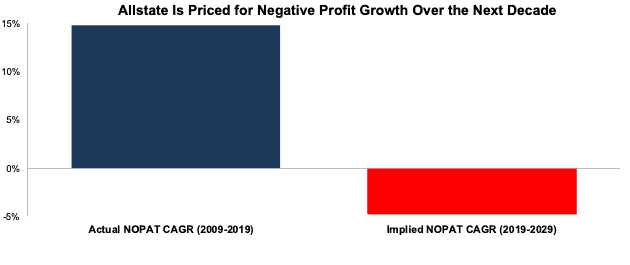
Figure 10 compares the firm’s implied future 10-year NOPAT CAGR in this scenario to its historical NOPAT CAGR over the previous 10 years.
Figure 10: Prior Decade’s NOPAT CAGR vs. Implied Future 10-Year CAGR
Sources: New Constructs, LLC and company filings.
Big Upside Even Without a Full Recovery
If we assume that the global economy grows moderately in 2021, ALL is highly undervalued.
In this scenario, we assume:
- NOPAT margin falls to 3% (all-time company low, excluding 2008) in 2020 and rebounds to 7% (all-time company average) in 2021 and each year thereafter
- Revenue falls 20% in 2020 – equal to the YoY revenue decline from 2007-2008
- Revenue growth returns in 2021 at the IMF’s global base-case GDP growth rate of 5.2%
- Revenue grows at 3% a year thereafter, which equals Allstate’s revenue CAGR over the past decade
In this scenario, Allstate’s NOPAT falls 1% compounded annually (including 75% YoY in 2020) over the next decade, and the stock is worth $145/share today – a 63% upside to the current price. See the math behind this reverse DCF scenario.
For comparison, Allstate has grown NOPAT by 6% compounded annually over the past five years and 2% compounded annually over the past two decades. It’s not often investors get the opportunity to buy an industry leader at such a discounted price.
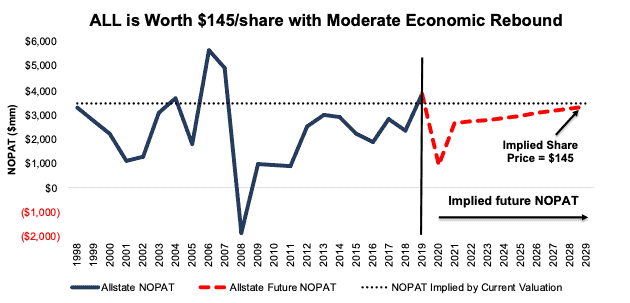
Figure 11 compares the stock’s implied future NOPAT in this scenario to the firm’s historical NOPAT. This scenario implies that ten years from now, the firm’s NOPAT will be 13% below its 2019 level, and just nearly equal to the NOPAT earned in 1998 and 2004. If the firm’s profits fully recover to its 2019 levels, ALL has even more upside potential.
Figure 11: Implied Valuation with Prolonged Recovery
Sources: New Constructs, LLC and company filings.
The Importance of Reliable Fundamental Data
In times of uncertainty, it pays to incorporate accurate fundamentals into investment decision making. Having access to reliable data can reveal situations where the market has overly pessimistic expectations of fundamentally strong companies. It’s important that investors make decisions based on the best data available.
David Trainer owns DHI, SPG, and JPM.
David Trainer, Kyle Guske II, and Matt Shuler receive no compensation to write about any specific stock, style, or theme.


