
5 Nasdaq 100 Stocks For Momentum Investors - April 26, 2016
Today I used Barchart to sort the NASDAQ 100 Index stocks first for the most frequent number of new highs in the last month, then again for technical buy signals of 80% or more. Next I used the Flipchart feature to review the charts for consistency.
Today's watch list includes: 21st Century Fox (Nasdaq: FOX), Gilead Sciences (Nasdaq: GILD), Liberty Interactive (Nasdaq: QVCA), Amgen (Nasdaq: AMGN) and Ulta Salon Cosmetics (Nasdaq: ULTA)
21st Century Fox
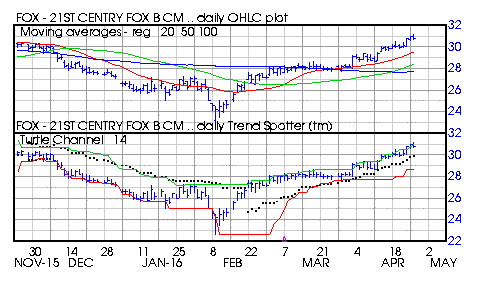
Barchart technical indicators:
- 96% technical buy signals
- Trend Spotter buy signal
- Above its 20, 50 and 100 day moving averages
- 15 new highs and up 9.85% in the last month
- Relative Strength Index 73.46%
- Technical support level at 30.42
- Recently traded at 30.83 with a 50 day moving average of 28.40
Gilead Sciences
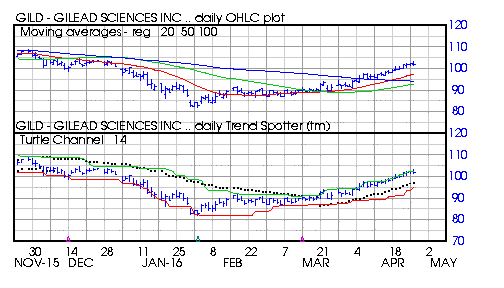
Barchart technical indicators:
- 80% technical buy signals
- Trend Spotter buy signal
- Above its 20, 50 and 100 day moving averages
- 15 new highs and up 11.06% in the last month
- Relative Strength Index 70.36%
- Technical support level at 101.18
- Recently traded at 101.45 with a 50 day moving average of 92.79
Liberty Interactive
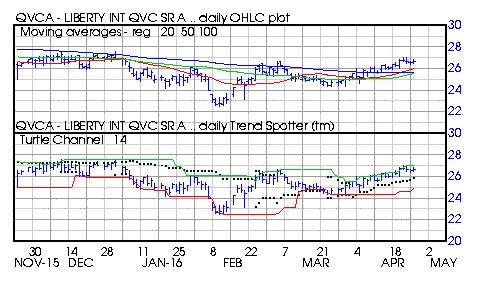
Barchart technical indicators:
- 80% technical buy signals
- Trend Spotter buy signal
- Above its 20, 50 and 100 day moving averages
- 14 new highs and up 7.81% in the last month
- Relative Strength Index 62.65%
- Technical support level at 26.31
- Recently traded at 26.71 with a 50 day moving average of 25.53
Amgen
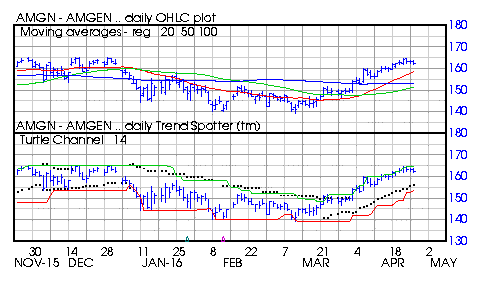
Barchart technical indicators:
- 80% technical buy signals
- Trend Spotter buy signal
- Above its 20, 50 and 100 day moving averages
- 13 new highs and up 8.62% in the last month
- Relative Strength Index 64.60%
- Technical support level at 161.55
- Recently traded at 162.57 with a 50 day moving average of 151.36
Ulta Salon Cosmetics
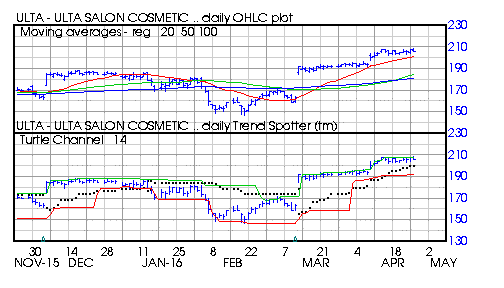
Barchart technical indicators:
- 80% technical buy signals
- Trend Spotter buy signal
- Above its 20, 50 and 100 day moving averages
- 11 new highs and up 7.44% in the last month
- Relative Strength Index 66.49%
- Technical support level at 202.50
- Recently traded at 206.04 with a 50 day moving average of 184.62
Disclosure: None.
How did you like this article? Let us know so we can better customize your reading experience.

Comments
Leave a comment to automatically be entered into
our contest to win a free Echo Show.

