
5 Monster Stocks To Watch For The January 21 Trading Session
The equity market was closed in the US on Monday, but the markets around the rest of the world were open. Most of the markets in Europe traded lower on the day with the expection of Germany, which increased by around 17 basis points.
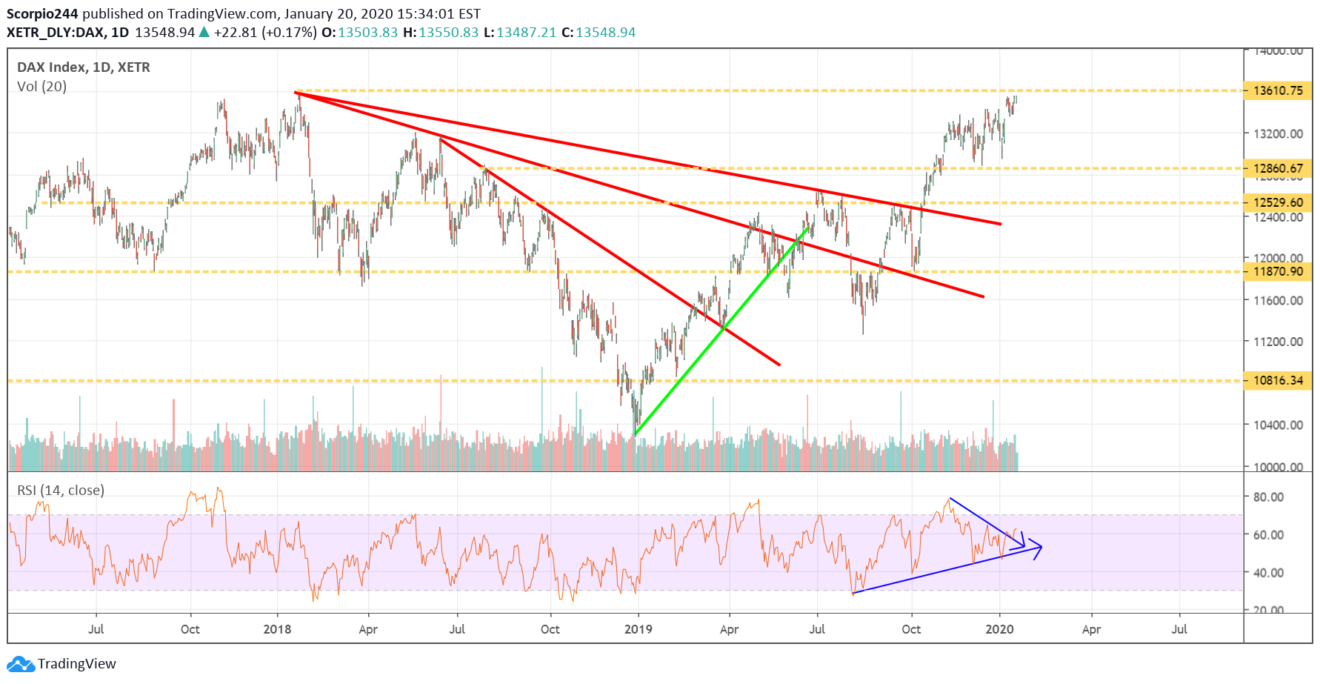
Germany (EWG)
The DAX is now trading just below an all-time high and resistance at 13,610. It becomes a big test of the index, with a rise above resistance acting as confirmation to the strength we have seen here in the US.
Maybe the Fed’s “NOT QE” is pumping up that market too :P.
(Click on image to enlarge)
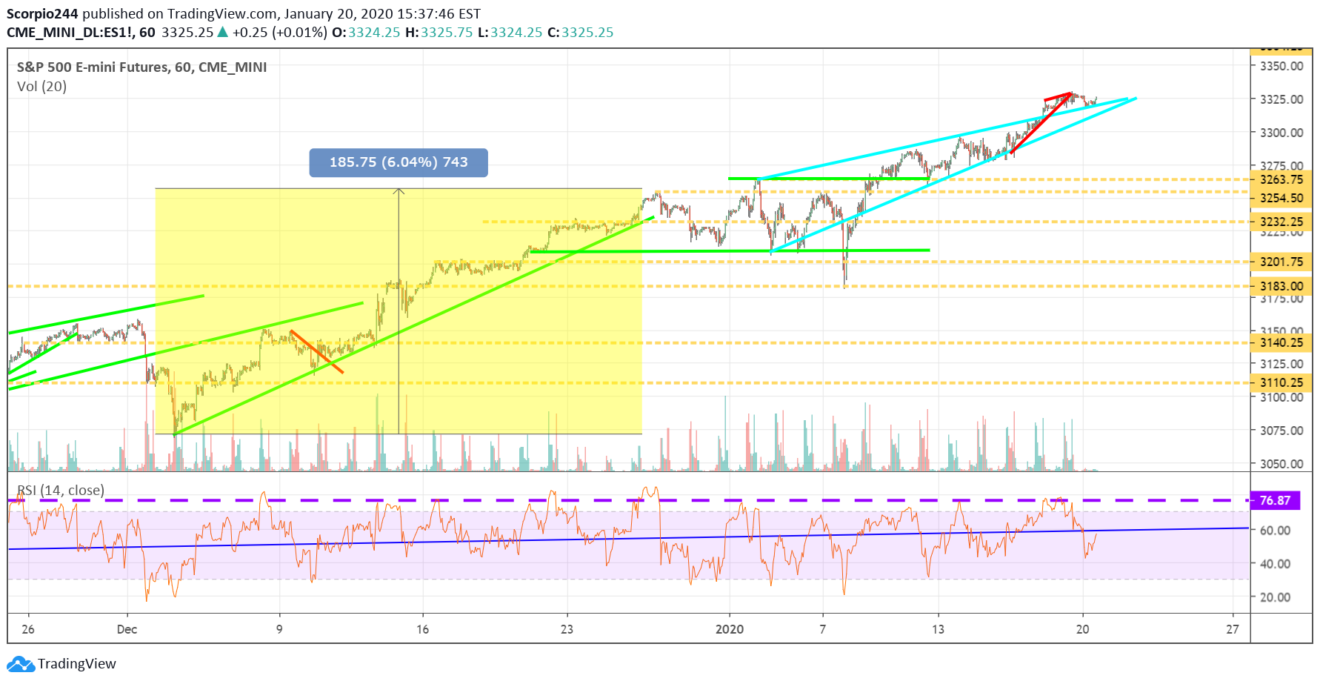
S&P 500
S&P 500 futures finished flat today, but there was minimal volume trading, so I’m not sure that it means much of anything. We will get a better sense when they start up again at 6 pm.
The chart below shows the rising wedge pattern I have been watching, along with the bump that formed. The question is, what happens now. A LOT of people have been telling me they think the market is going higher from here, and that my call for a 2-3% pullback is off base and wrong. I guess we will see this week.
(Click on image to enlarge)
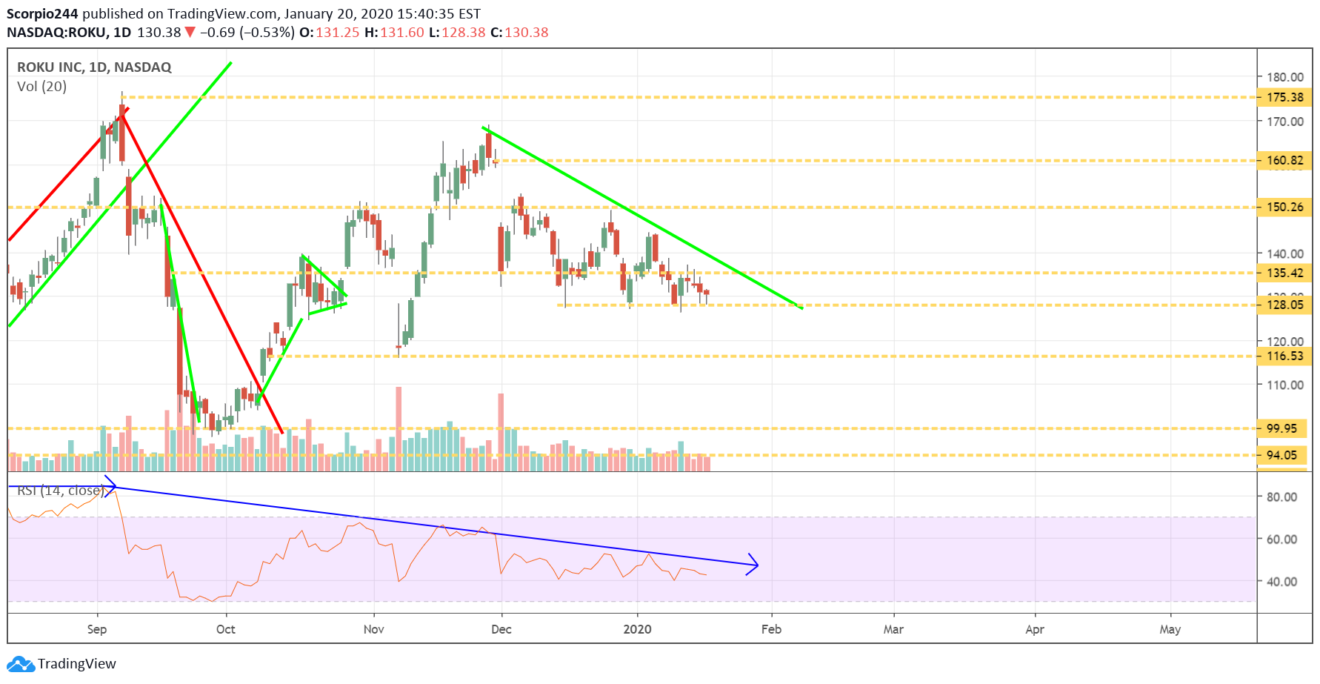
Roku (ROKU)
I have been saying for days how much I’m not too fond of the way the Roku chart looks and how I think the stock is heading lower. Shares have been testing support at $128 now on several occasions. It will need to break soon for me to have made the correct call.
(Click on image to enlarge)
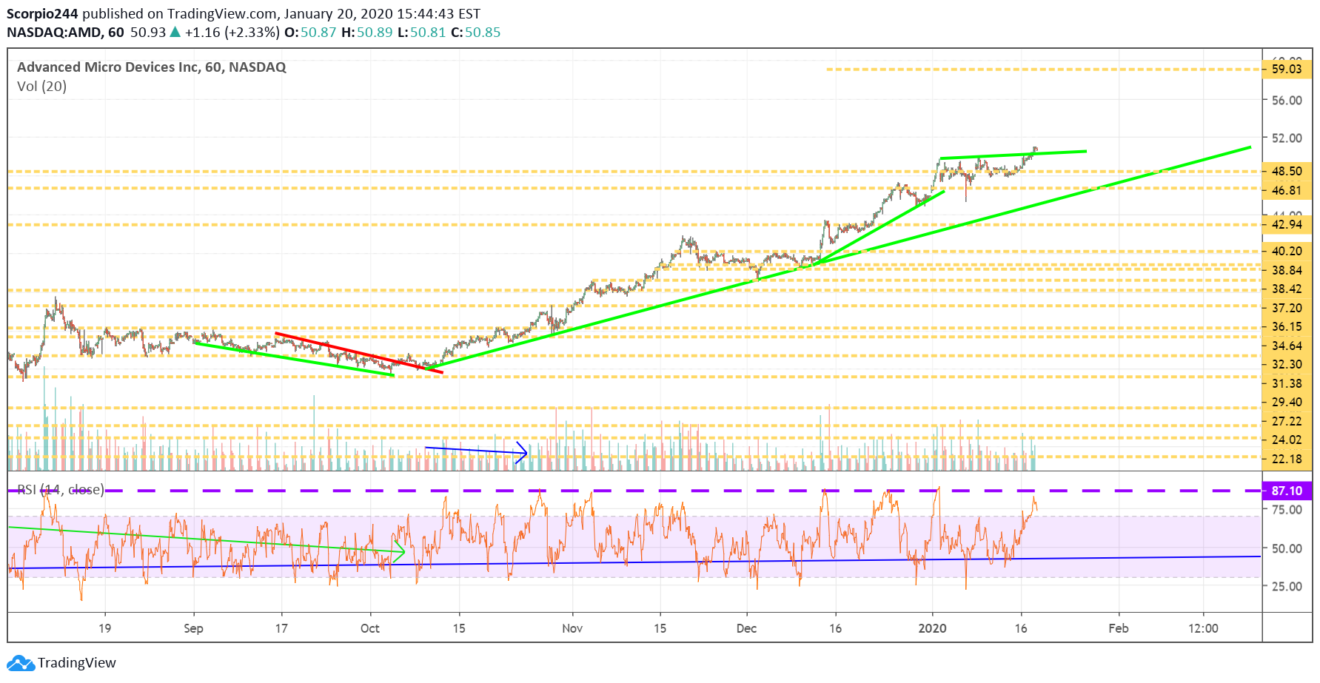
AMD (AMD)
It looks like AMD is moving up again, as it finally broke out of that consolidation phase. It would be crazy if this thing went to $60. Free article- AMD’s Bulls Are Growing Even More Bullish
(Click on image to enlarge)
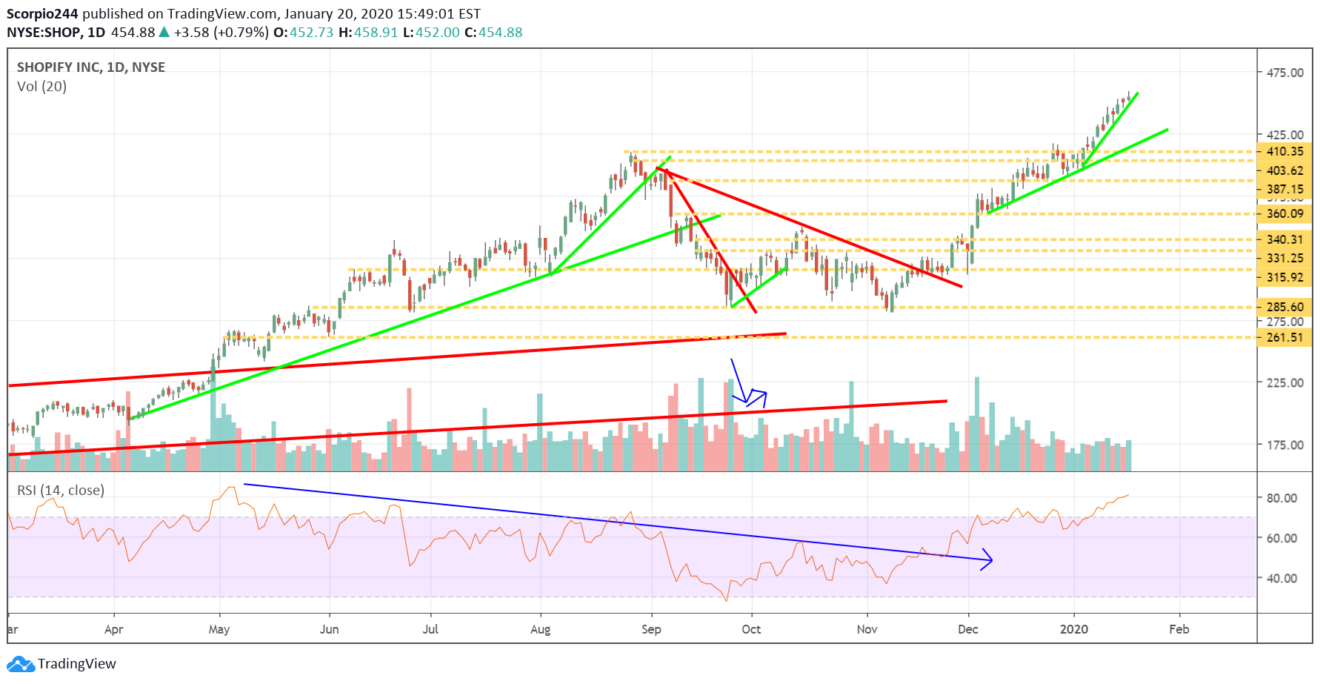
Shopify (SHOP)
Shopify has been a beast since coming off that double bottom at $285. But now it has formed a bump and run reversal pattern. That means a pullback may coming, and support comes in the $410 to $420 region.
(Click on image to enlarge)
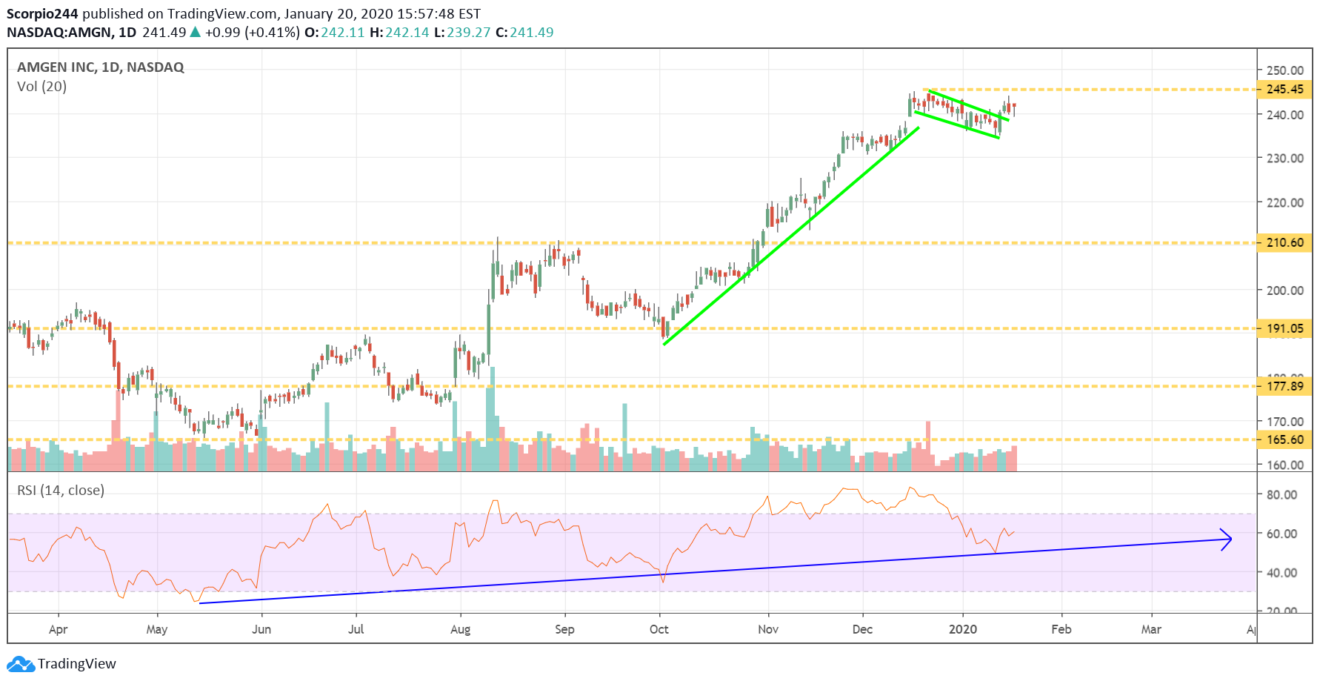
Amgen (AMGN)
Amgen has been rising sharply in recent months, and it looks like it may start pushing higher again. The RSI indicates the stock is in a longer-term uptrend, and the stock appears to have formed a bullish flag pattern. The only thing we need to do now is to wait and see what happens at resistance around $245.50.
(Click on image to enlarge)
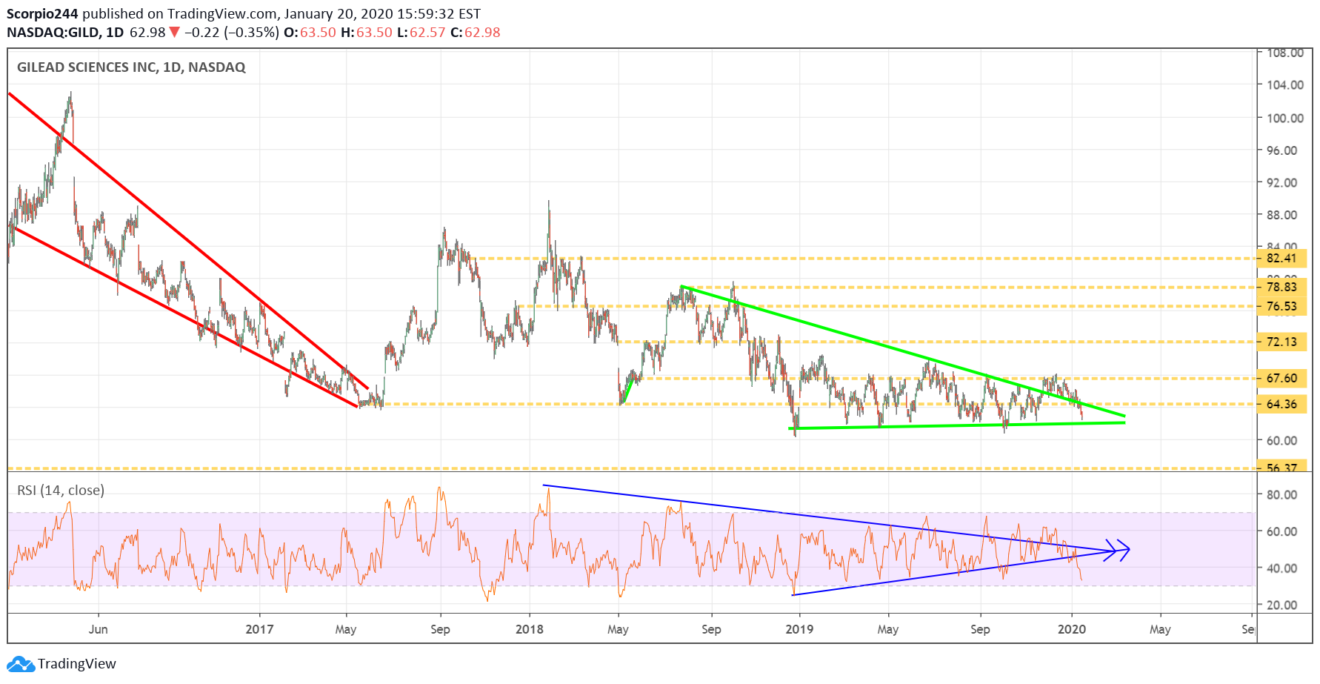
Gilead (GILD)
Unfortunately, we can’t say the same for Gilead; now, even the RSI is breaking down. Not a good sign. The stock appears to be lost, and a total waste of time at the moment.
(Click on image to enlarge)
Disclaimer: This article is my opinion and expresses my views. Those views can change at a moment's notice when the market changes. I am not right all the time and I do not expect to be. I ...
more

