
2 Streaming Stocks Are Nearing Key Technical Levels

Photo courtesy of Roku.
Netflix Inc. (NASDAQ: NFLX) and Roku Inc. (NASDAQ: ROKU) are two streaming stocks moving during Wednesday's trading session. Netflix is trading lower after the company issued second-quarter sales guidance below estimates. Roku is trading lower in sympathy with Netflix.
Both stocks are nearing key lines on the chart; a break of these lines could bring about a more powerful move.
(Click on image to enlarge)
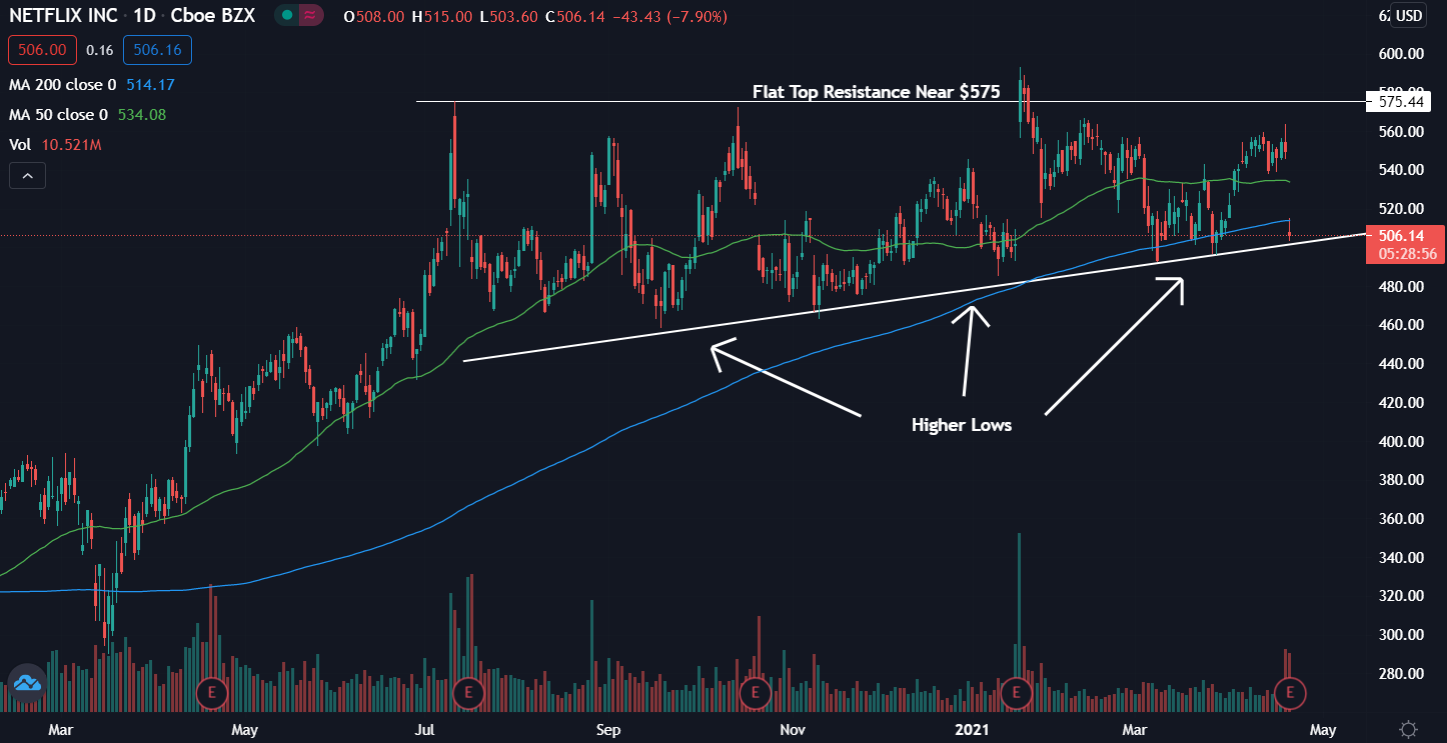
Netflix Daily Chart Analysis: Netflix gapped down to near a key level into Wednesday morning.
The stock gapped down below both the 50-day moving average (green) as well as the 200-day moving average (blue), indicating sentiment could be turning bearish.
These indicators may hold as resistance again in the future.
The stock was down 7.24% at $509.78 at last check.
Key Netflix Levels To Watch: The stock has been building higher lows throughout the last six months into what technical traders may call an ascending triangle pattern.
The ascending triangle shows a flat top resistance near the $575 level, as this is a price level where sellers have always been able to win against the buyers.
A break above flat top resistance with consolidation gives the stock a chance to push higher.
A break below the higher lows may cause the overall trend to change.
(Click on image to enlarge)
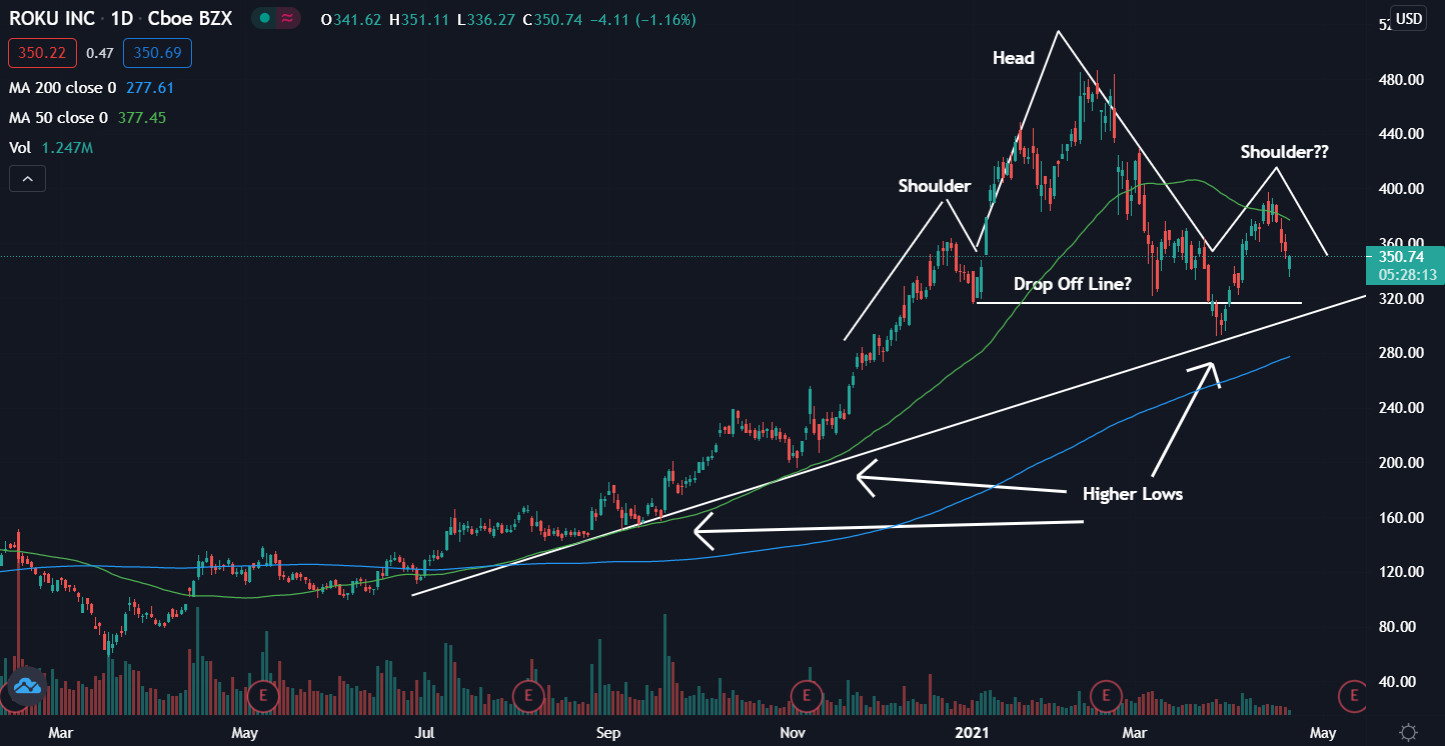
Roku Daily Chart Analysis: Roku is nearing a key level where, if it is unable to bounce, it may see a strong downward push.
The stock is trading below the 50-day moving average (green) and above the 200-day moving average (blue), indicating the stock is most likely in a period of consolidation.
The 50-day moving average may hold as resistance and the 200-day moving average may hold as support.
Roku shares were down 0.9% at $351.66 at last check.
Key Roku Levels To Watch: The Roku chart shows it may be forming what technical traders call a head-and-shoulders pattern.
The head-and-shoulders pattern is a bearish reversal pattern that may be confirmed if the stock can fall below where buyers were previously found near the $320 level.
The higher lows show the overall trend has been bullish and the line connecting the lows would need to hold as support or the stock may begin a downtrend.
Disclaimer: © 2021 Benzinga.com. Benzinga does not provide investment advice. All rights reserved.


