
10 Years And 401% Later: A Look At The Longest "Bull Market" Ever
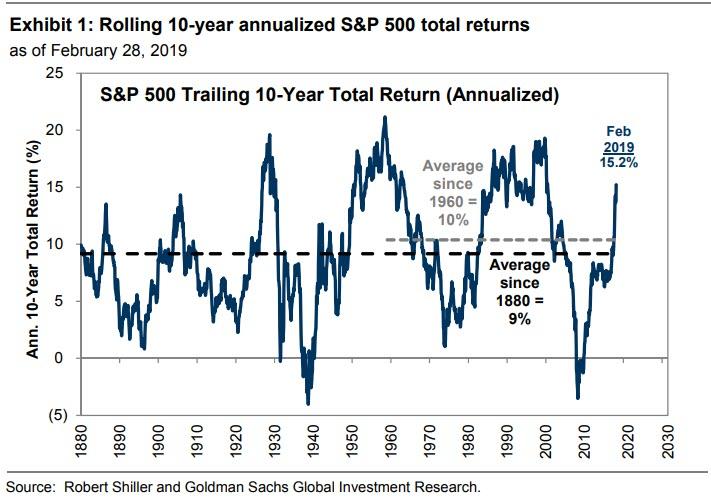
Exactly ten years ago on March 9, 2009, just as rumors were swirling that the Fed would unleash and expand its QE1 program by $1 trillion (confirmed on March 18, 2009), the current "bull market" began and since then, despite coming within inches of ending twice once in 2011 and again on December 24, 2018 when a last minute buying surge prevented a 20% peak to trough drawdown, the S&P 500 has climbed by 306% in price, or 15.2% annualized, while including dividends, the index has generated a total return of 401% (17.5% annualized), ranking in the 94th percentile of 10-year annualized returns since 1880.
Curiously, despite the record duration of the bull market, which was made possible largely thanks to two key catalysts: an unprecedented expansion of central bank balance sheets which bought over $15 trillion in assets in the past decade, as well as trillions in stock buybacks, the S&P 500’s return including dividends trails all but one of the 12 bull runs since the Great Depression. In fact, according to Bloomberg, along with the post dot-com bubble advance of 2002-2007, it’s one of only two cycles that hasn’t scored annualized returns of 20 percent or more.
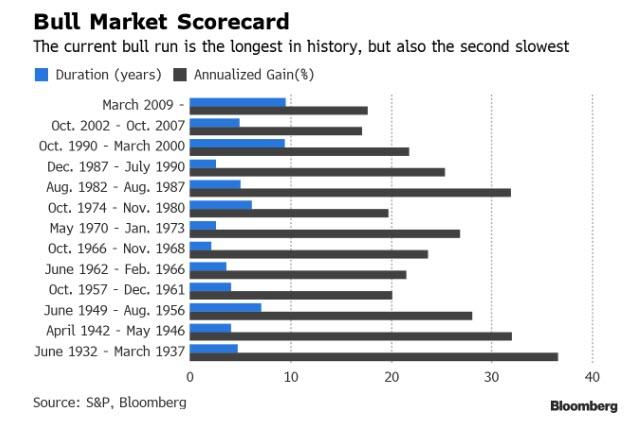
While the length of the "bull market" is staggering, Bloomberg makes the case that depending on how one looks at it, the past 10 years have been relatively underachieving as far as bull markets go: at its all-time high reached in September, the S&P 500 stood roughly 80% above its most recent peak, in October 2007. While certainly impressive, it’s far from the biggest, as during three other cycles - 1949-1956, 1982-1987, 1990-2000, the bull run didn’t stop until share prices had doubled from their previous top.
“When you ascend far enough, the air gets thin, as I am finding out as I climb stairs in Colorado,” said Brad McMillan, chief investment officer for Commonwealth Financial Network.
Meanwhile, as noted above, the rally nearly ended on two occasions when it just barely missed the cutoff of a -20% drawdown that denotes the end of a bull market. As Goldman's David Kostin notes, at one point in 2011, the S&P 500 had dropped 19.4% below its high. More recently, on December 24, 2018 the S&P traded 19.8% below the September all-time high, having slid below 20% intraday and only a surprising late day bid preserved the rally... just as Steven Mnuchin was calling the Plunge Protection Team. For now, following the torrid rebound in January and February, the bull marches precariously on, with a realized volatility of 16.0 since 2009, in line with the 50-year median of 16.1.
So for those curious what trillions in central bank purchases and buybacks can do to a "bull market", here are some stats courtesy of Goldman Sachs:
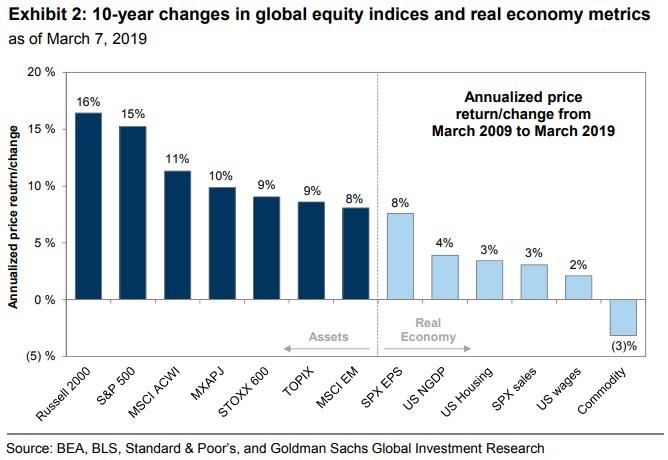
- US stocks have significantly outperformed global equities during the past 10 years. Asia-Pacific (MXAPJ, 10% annualized price return), Europe (STOXX 600, 9%), Japan (TOPIX, 9%), and broad Emerging Markets (MSCI EM, 8%) all trailed the S&P 500. The Russell 2000 index of small-cap US equities fared best, returning 16% annualized since March 2009. While asset prices rose, the real economy expanded at a more modest pace with annualized US nominal GDP growth of 4% during the past decade. S&P 500 sales increased at a similar pace (3%) while margin expansion helped drive 8% EPS growth. Home prices rose at an annualized rate of 3% since the equity market low.
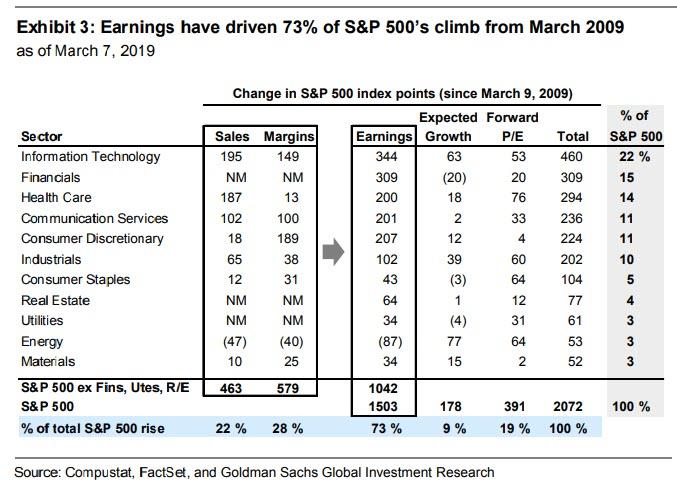
- Earnings drive stocks over time. Profit growth accounted for nearly 75% of the 10-year climb in the S&P 500 index as trailing EPS rose by 140% from $67 at the market low to $161 during the past 12 months. Revenues increased by 43% and contributed 22% of the index gain. Corporate profit margins have expanded by nearly 500 bp from 7.3% at the low to the current all-time high of 12.2%, contributing 28% to the index rise. Only 19% of the S&P 500 index change since 2009 stemmed from expansion in forward P/E multiple (10x to 16x).
Which sectors and companies generated the bulk of the returns:
- Information Technology contributed 22% of the index-level return during the past decade. Info Tech earnings have nearly tripled since the cycle low, driving 75% of the sector’s 10-year return. Sales growth accounted for more than half of the Tech earnings growth with margin expansion contributing the balance.
- Financials were the second-largest contributor to the S&P 500 bull market, accounting for 15% of the index return since 2009. Nearly all of the Financials return came from profit growth rather than valuation expansion.
- Energy is the only sector where the level of earnings per share actually declined (-35%). Part of the reason for the drop in EPS is the high starting point for WTI oil prices. Oil prices averaged $92/barrel during the 12 months leading up to March 2009 (first rising above $140/barrel and then sliding below $40). Fast forward, and during the past year WTI has averaged $63/barrel. In aggregate, the Energy sector accounted for just 3% of the index-level return during the past decade – similar to contributions from the Materials and Utilities sectors.
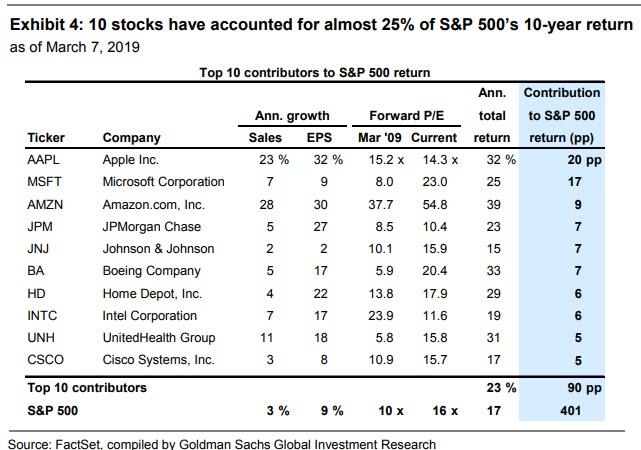
At the company level, just ten stocks accounted for nearly 25% of the 10-year index return.
- AAPL shares generated a 32% annualized total return during the past 10 years and singlehandedly accounted for 20 percentage points of the S&P 500 total return. Powered by the iPhone, AAPL sales rocketed upwards at a 23% annualized rate and EPS surged by 32% annually for the past decade. With such dramatic growth in the top- and bottom-line, the slip in forward P/E multiple from 15.2x to 14.3x hardly mattered.
- Microsoft is the opposite story. In delivering a 25% annualized total return during the past decade, MSFT shares were the second-largest contributor to the S&P 500 index return since 2009, accounting for 17 percentage points of the index return. While MSFT sales and EPS grew at an annualized rate of 7% and 9%, respectively, during the last decade, the forward P/E multiple expanded from 8.0x to 23.0x. AMZN (39% annualized total return and 9 pp of S&P 500 index), JPM (23% and 7 pp), and JNJ (15% and 7 pp) round out the top five index return contributors.
While profits rose by an impressive 140% in the past decade, the aggregate S&P 500 forward P/E multiple has also expanded from 10x to 16x (+58%) this cycle and ranks at the 74th percentile vs. history. However, as Goldman notes, a defining characteristic of the current bull market has been extraordinarily low bond yields. The yield gap, which compares the S&P 500 earnings yield with the 10-year US Treasury yield, currently stands at 350 bp (6.1% earnings yield vs. 2.6% note yields), compared with the 40-year average of 250 bp and ranking in just the 29th percentile. The yield gap measured 490 bp in March 2009 (13th percentile).
As an aside, Goldman now forecasts that S&P 500 returns "will be modest in the near-term" and recommend investors focus on relative value and idiosyncratic opportunities. The positive impact on equity valuations from a patient Fed unlikely to tighten the funds rate for the rest of the year is offset by the negative impact of an anticipated recession in 1Q aggregate S&P 500 EPS. As a result, Goldman's forecast is that the S&P 500 will close mid-year at 2750, unchanged from today, however, it then sees the S&P rising by 9% to 3000 by year-end 2019, even as the firm admits that mounting pressures from wage inflation and other input costs will pressure margins, making further expansion from currently all-time high margins unlikely. As a result, growth in EPS will be driven entirely by top-line sales. Equity valuations will remain well below their recent January 2018 highs.
A few final observations on the current rally in context: while of extreme duration if of relatively shallow slope, in February, the S&P 500’s return over 10 years crossed 350%, a threshold that according to New Davis Research has been breached only three other times: in December 1952, February 1987 and October 1997. And just like the current cycle, those instances all followed big market crashes and occurred within a prolonged uptrend.
So is the current geriatric bull almost over? According to at least one indicator, it may have even more to go - after the initial breakout above the threshold, stocks continued to advance, with the S&P 500 rising an average of 58% before suffering a bear market. There is, however, one major difference between now and those previous bull markets: as Bloomberg notes, what’s different this time is the catatonic economic backdrop, as US GDP expanded at an average rate of only 1.8% over the past decade, compared with 4.3% in the 1950's and 3.2% in the 1990's. And with GDP expected to decline substantially in 2019 and even more in 2020 once the recent fiscal boost becomes a headwind, the question is can the Fed do everything in its power and push on a string some more just to extend the duration of the current record long bull market by a few more quarters, just as it has for the past 10 years.


