
% Of S&P 500 Stocks Above 50DMA In Mid-Teens But Yet To Hit Panicky Single Digit
Inflation is front and center, driving investor sentiment. April’s CPI report, out yesterday, proved expensive for equity bulls. The S&P 500 is down nearly 19 percent from its January high, even as the percent of stocks above the 50-day is extremely oversold, if not washed out.
Equity bulls are not getting any help whatsoever from inflation.
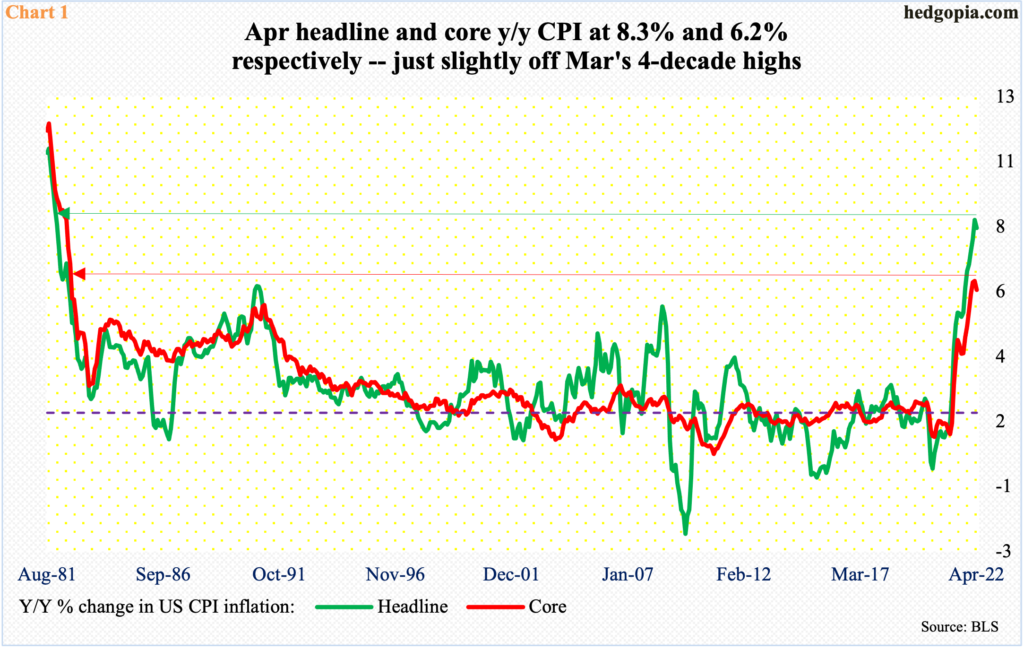
April’s consumer price index (CPI) was published on Wednesday, and it was hotter than expected. From a year ago, headline CPI surged 8.3 percent, versus the consensus of an 8.1-percent rise; core CPI jumped 6.2 percent, against expectations for a six-percent gain.
Markets were hoping for signs of a peak in inflation, but they did not get it conclusively. Although the fact remains that April’s pace was a little softer than March’s, when headline and core CPI respectively increased 8.5 percent and 6.5 percent – the steepest since December 1981 and August 1982, in that order (Chart 1). In theory, it is still possible CPI peaked in March.
But the fact that inflation came in higher than markets’ forecast in April was used as an excuse to further sell equities on Wednesday.
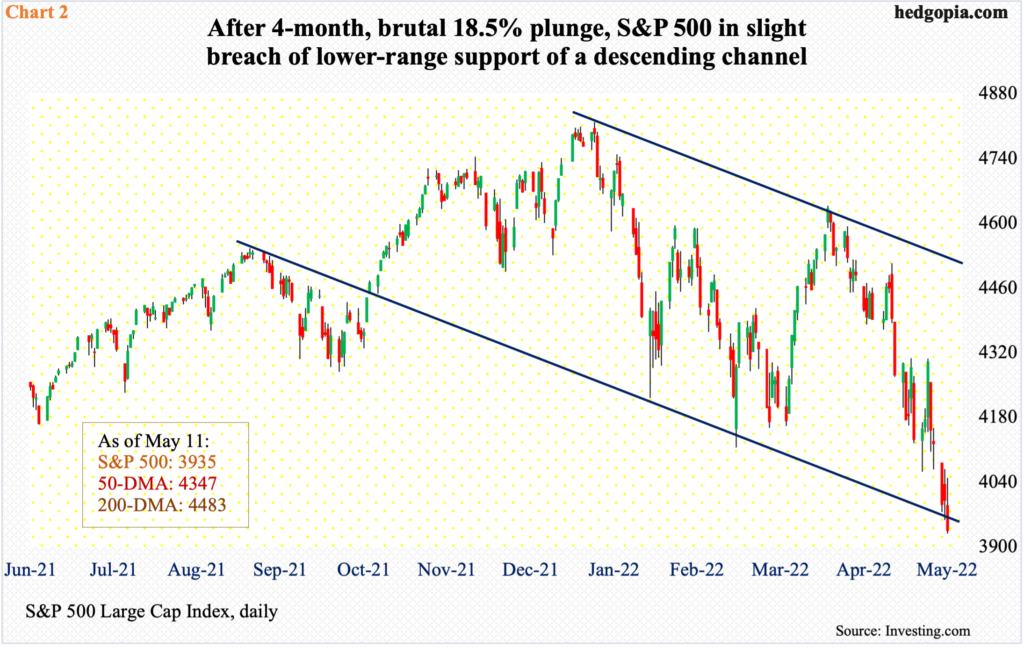
The S&P 500 shed 1.7 percent on Wednesday, reversing a 1.2-percent gain at the session high. From the January 4 record high of 4819 through Wednesday’s low of 3929, the large cap index gave back 18.5 percent.
Along the way, it broke several supports, not the least of which is the 50- and 200-day moving averages. Since the high four months ago, there has been an established pattern of lower highs, and lower lows. It so happens that the index currently is probing the lower range of a descending channel thereof; as a matter of fact, there has even been a slight breach (Chart 2).
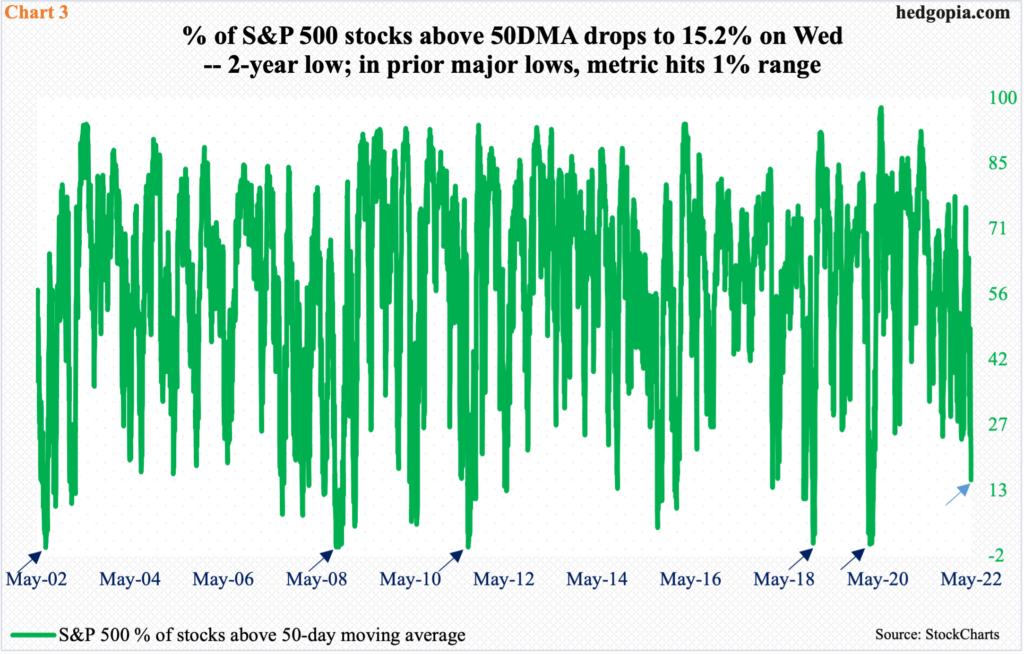
Concurrently, the percentage of S&P 500 stocks above the 50-day dropped to 15.2 percent on Wednesday (light blue arrow in Chart 3). On March 29, 75.8 percent were above the average. This speaks of what kind of damage the index has sustained in the ongoing selloff.
There is this, though. In March 2020, this metric dropped as low as 1.2 percent. There have been four other major lows in the S&P 500 over the past two decades, and on each occasion, this indicator dropped to the one handle or lower – July 2002, October 2008, August 2011, and December 2018 (dark blue arrows).
It is entirely possible the current selloff does not capitulate until Chart 3 reaches a panicky phase. Even in this scenario, this metric is not that far away from a washout zone.


