
Stock Market Update: Have We Reached Cruising Altitude Yet?
The Higher The Better
The S&P 500, from take-off at $2346.58 on December 26 to $2743.35 today, has finally risen to its 200-day simple moving average – almost 400 points in less than 8 weeks. For many traders and investors, what happens above the 200-Day MA is bullish and below is bearish.
This Maginot line serves as both a health indicator as well as a magnet. So now that we have traveled up this far, are we at Cruising Altitude yet?
One of the central reasons behind aircraft altitude is that as the air gets thinner with every foot climbed, planes can travel more easily and therefore move faster and burn less fuel, saving money. We saw this flying metaphor in full effect leading into the most recent SPX top of $2941 on September 21, 2018. This leading index had not spent any (meaningful) time below the 200D since 2016 – when it was $1833. That’s a 1131 point run! Sure, there was turbulence (aka XIV Implosion) in Jan-April of 2018, but this flight path never dropped below Cruising Altitude!
Now as we re-engage with this “sweet spot” of flying, we need to keep in mind: too high and the oxygen becomes too sparse to fuel the engines; too low and the air resistance is greater. The optimum altitude for a plane is based on its weight. In the case of a stock, it’s value. Keep in mind, heavier planes will fly lower, and lighter planes higher.
And boy can we see this analog in those SaaS/Cloud plays that have flown well above Cruising Altitude and look like they will climb forever! Think: TWLO, WDAY, TEAM, COUP, MDB, SPLK, and many many other Flying Unicorns valued in the Billions of market cap despite revenues at a fraction of that.
It comes down to this in aviation-speak: the higher the cruising altitude, the lighter the aircraft due to less drag, fuel usage and thinning air. (It’s not called “Blue Sky” trading for nothing!!) But life in the stratosphere, can cause engines to struggle as the oxygen levels fall.
And that’s all I’m gonna say about that.
Macro Matters
Last week, stocks stalled as the S&P approached its 200D. With only 3-points to go to tag the 200D, traders were frustrated as the SPX traded in a 1-point range all week long. This week, China came back online after a week of holiday closure, OPEC promised cuts, US-China trade talks started and US Government Shutdown Showdown looked ready to resolve.
And this followed the news last Friday of the QE to infinity story: “Fed debating if balance sheet should be regular tool.” If there were Sellers about to step up, they quickly realized they needed to pause. Here’s a lifted tweet to showcase both sides of the argument proposed by Greg McKenna.
So yeah, Daly said we can use QE as a tool
— Greg McKenna (@gregorymckenna) February 8, 2019
But the bigger AND BETTER debate (maybe epiphany) the #Fed may have had is this is old school central banking, QE is not one sided & if the market can get used to buying & selling bonds they can more effectively manage the economy. 5/6
With that, the Fed doesn’t seem in a hurry anymore to run-off their balance sheet or raise rates to get “in front of inflation” (which crashed with oil) or to combat an overheating economy (which suffers from synchronized global growth slowdown). I will be watching, however, for the 10 year Treasury yield to rise on any rebound in oil prices, recovery in inflation expectations, and continued strength in the US dollar.
Earnings Recession Fears
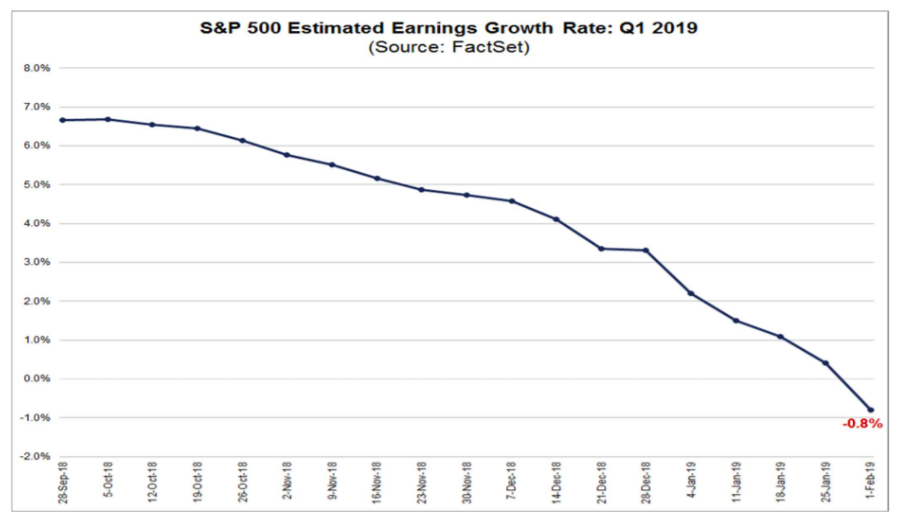
Wall Street’s expectations for Q1 2019 earnings growth has been falling, and is now negative.
The earnings recession has started. At the end of Sept, the consensus was +6.7% for YoY EPS. By end-2018, that estimate was down to +3.3%. And now -0.8%, with six of the eleven sectors in negative terrain.
— David Rosenberg (@EconguyRosie) February 11, 2019
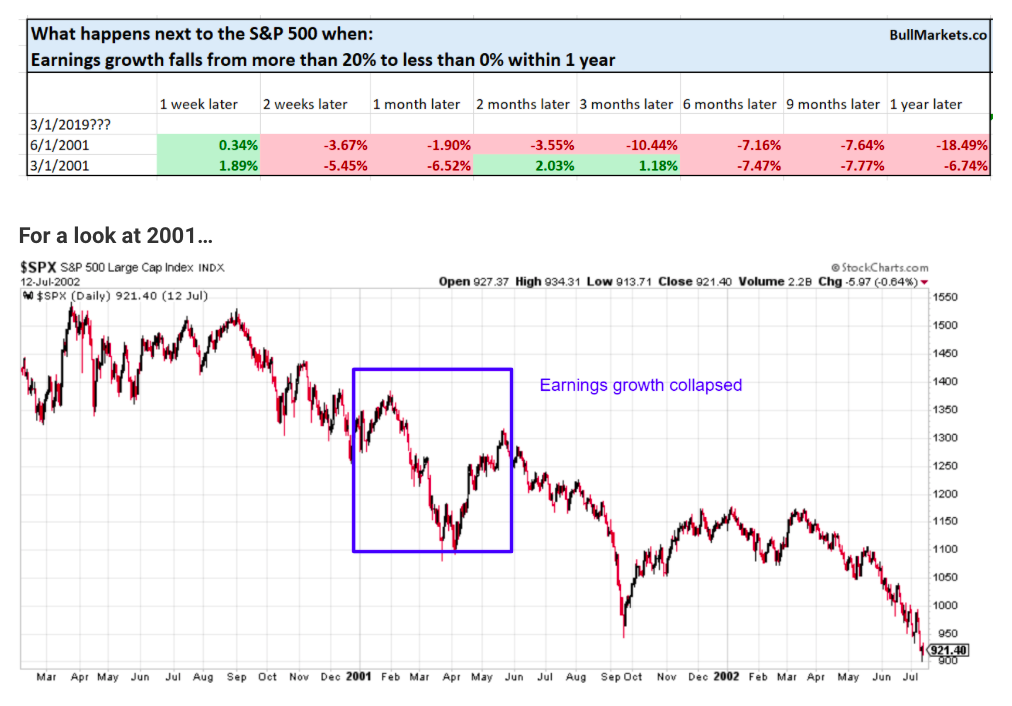
From 1990 – present, there has only been 1 other case in which earnings growth fell from more than 20% to less than 0% within 1 year. – Troy Bombardia
The rapid increase in EPS growth driven by tax reform is not sustainable
What a Round Trip it has Been! Since the tax bill passed in December 2017, the return on the stock market has been ABSOLUTELY ZERO! What we gained in tax breaks we lost in trade wars. Except that now the bill is due with $1.8 trillion in new government borrowing this year. Oops! That is NOT what they promised. – John Thomas
And although the market doesn’t seem to care right now, at some point it will.
MORGAN STANLEY CUTS BASE CASE 2019 S&P 500 EPS GROWTH FORECAST TO 1 PCT FROM 4.3 PCT.
Slowing global growth should mean slowing revenue growth. So while stock prices have and can continue to recover, important underlying fundamentals could start to reflect the fears that drove the first panic selling in early 2018 and again in late 2018.
US Dollar Strength
Last week I noted that with the USD strength it was a surprise the Euro was not trading lower. By Monday, the Euro had decisively broken $1.13 as the DXY has risen 8 days in a row. And it’s no wonder: Italy is in recession. Germany is sliding into recession. France is struggling with YellowVest protesters. The rate of change on a major asset class, like US dollars, can be a Big Tell for an inflection point for equities. Remember late 2014 through March 2015 when the US dollar had one if its strongest 6-month periods while earnings fell steadily. Right now, this USD advance is the strongest in 2 yrs just as China comes back online to discuss trade tariffs; Gold and Crude struggle to hold critical support; not to mention the revision estimates to earnings falling off a cliff.
If Brexit would get resolved and a China trade agreement would get inked, I could see some relative strength evolving for non-US currencies. Also with the Fed done for a while, thus alleviating the “real rate of interest” differential with foreign countries, that could be another reason for the dollar to weaken. – Brian Gilmartin
But with the European Economy in decline, and the EC’s forecast of economic growth cut from 1.9% to 1.3% in large part due to the US-China Trade Wars, is it any wonder the US Dollar is bid up as safe haven? The one big tailwind to the continuing market advance is global synchronized slowdown. And ironically. the slowdown will accelerate as the dollar picks up speed to the upside.
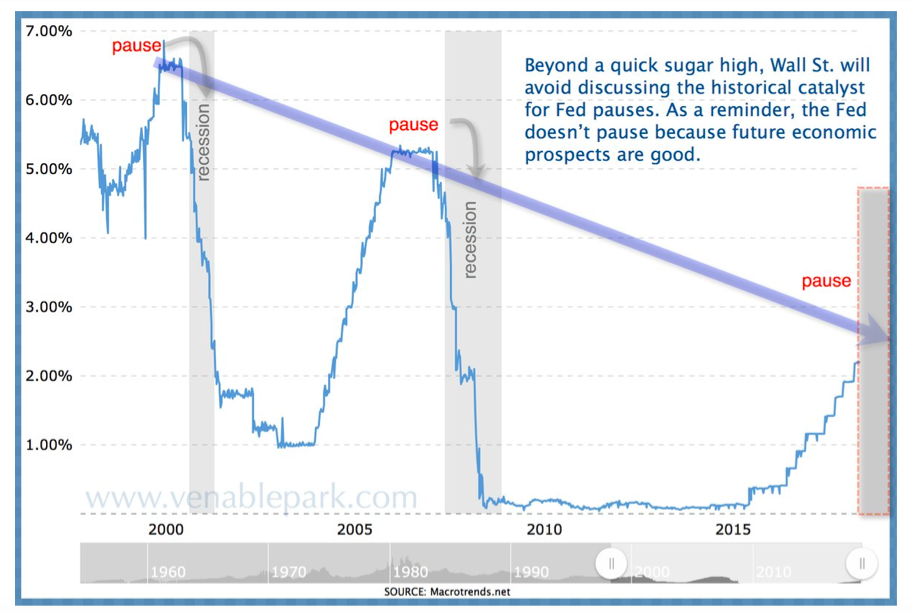
Fed In “Calming” Mode
Great point here from Jeff Miller, Dash of Insight:
The Fed will be patient in waiting for actual signs of inflation and flexible in the pace of balance sheet reduction. The Fed and the markets disagree over the strength of the economy and the significance of the continuing size of the balance sheet, but for now the Fed is in “calming” mode. Ace Fed watcher Prof. Tim Duy has a complete analysis of what happened, along with his own conclusions.
————
“What a difference a month makes. Stocks are up the most since 1987. A month ago there was a 45% probability of a rate hike in 2019. Now there is 45% probability of a rate cut. – Danielle DiMartino Booth of @DiMartinoBooth
To add insult to injury,any Fed Rate Cut to mitigate the trade war impacts may only cause market panic – as it did in prior cycles (charts credited to @CoryLVenable):
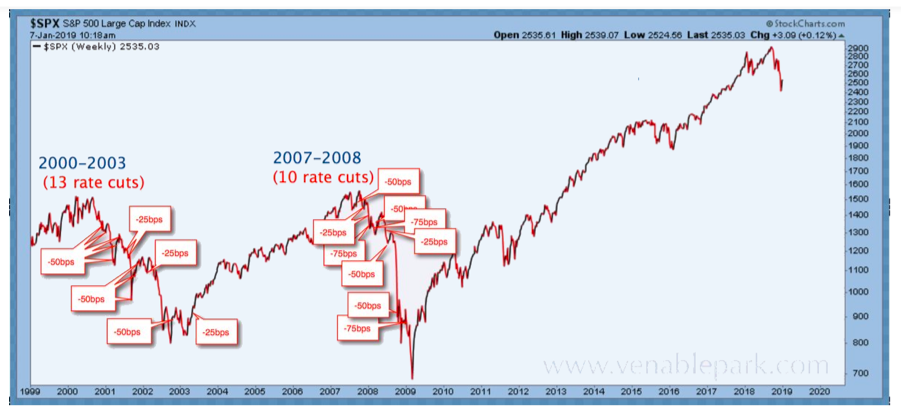
We should have a better read at the March FOMC meeting so add this date to your Volatility calendar: March 20th!


