
Stock Exchange: Do You Have A Strategy?
The Stock Exchange is all about trading. Each week we do the following:
- Discuss an important issue for traders;
- highlight several technical trading methods, including current ideas;
- feature advice from top traders and writers; and,
- provide a few (minority) reactions from fundamental analysts.
We also have some fun. We welcome comments, links, and ideas to help us improve this resource for traders. If you have some ideas, please join in!
Review: 3 Anomalies That Beat The Market
Our previous Stock Exchange asked readers if the market is efficient, or if there are opportunities to exploit anomalies? We suggested that momentum, seasonal declines, and niche strategies are anomalies that traders may want to consider. A glance at your news feed will show that the key points remain relevant.
This Week: Do You Have a Strategy?
As Michael Harris points out in this post: Drawing Lines On Charts Is Not A Strategy. We agree with him, and we also agree when he says “some use it [drawing lines on charts] as a way of communicating.” Further still, we agree with his point that “market traders need specific strategies… Instead of showing charts with random lines that reflect either confirmation bias or even confusion.” We’ll get into some of our trading strategies later in this report, and we’ll even communicate them with lines on charts.
Also interesting, Dr. Brett Steenbarger uses this unique and very insightful chart to show what is happening at varying price levels in the market.
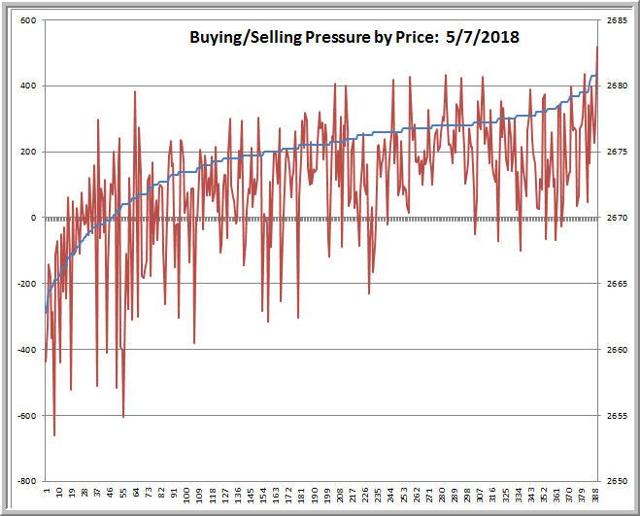
Specifically, the chart allows us to “visualize the amount of volume traded at each price level through the day.” As usual, Dr. Brett’s insights are tremendously valuable, and you can view his full write up here.
Another very interesting article from Stock Bee notes that stocks tend to move in short-term momentum bursts.
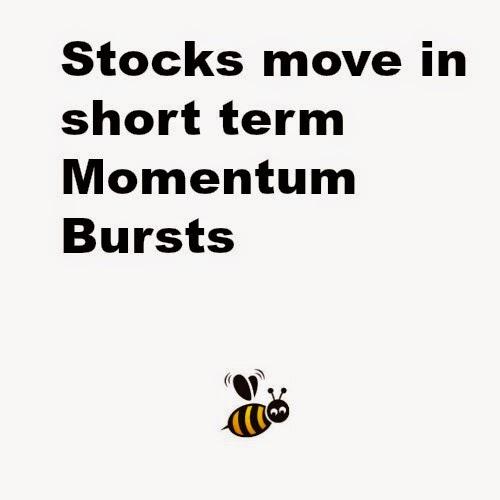
Momentum strategies continue to develop across the market as it tends to be one of those anomalies that actually bear fruit, as we noted in last week’s write up. We also include some specific momentum-based trading ideas later in this report.
Model Performance:
Per reader feedback, we’re continuing to share the performance of our trading models.
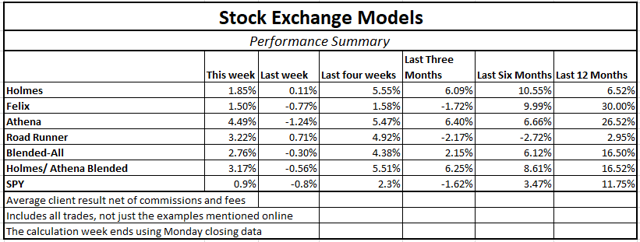
We find that blending a trend-following / momentum model (Athena) with a mean reversion / dip-buying model (Holmes) provides two strategies, effective in their own right, that are not correlated with each other or with the overall market. By combining the two, we can get more diversity, lower risk, and a smoother string of returns.
And for these reasons, I am changing the “Trade with Jeff” offer at Seeking Alpha to include a 50-50 split between Holmes and Athena. Current participants have already agreed to this. Since our costs on Athena are lower, we have also lowered the fees for the combination.
If you have been thinking about giving it a try, click through at the bottom of this post for more information. Also, readers are invited to write to main at newarc dot com for our free, brief description of how we created the Stock Exchange models.
Expert Picks From The Models:
This week’s Stock Exchange is being edited by Blue Harbinger; (Blue Harbinger is a source for independent investment ideas).
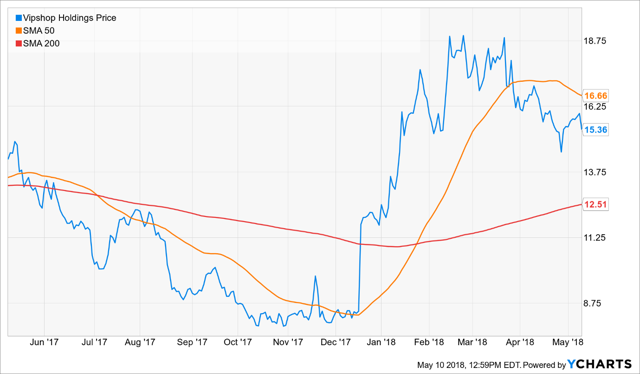
Holmes: After selling some of my position last week, I bought more Vipshop (VIPS) this week on May 9th for around $15.40 per share. As we discussed previously, VIPS is a Chinese company, and it trades as an ADR. It’s basically an online discount retailer for brand names. They have flash sales where they have a limited amount of brand name products to sell.
Blue Harbinger: Wow—you’ve been active in VIPS, Holmes. And even though your performance (as shown in our earlier table) has lagged some of the other models, I’m not going to give you a hard time about these multiple trades because your returns are still positive, and because I know your return stream is a valuable volatility-reducing addition when combined with other strategies. However, I am going to ask—why did you buy more VIPS, Holmes?
Holmes: As you know, I am a “dip-buyer.” And as you can see in the chart above, the shares have dipped in recent weeks. Usually I hold my positions for about 6-weeks, but that can be shortened based on various macro factors and if/when my price targets and stops are hit.
BH: Interesting trade, Holmes. And yes, I can see the “lines you’ve drawn” on the chart to help me visualize the movements. Also, as long as the global economy remains healthy this stock should have some wind at its back. That is assuming a global trade war can be avoided. Personally, I think the market often reflects the emotions of others, and your own fundamental analysis is more important. But alas Holmes, you are a technical model. Thanks for sharing this trade.
Road Runner: This week I sold RH (RH) (formerly Restoration Hardware). If you recall, I purchased this stock at about $87.50 back on April 11th, and I sold this week on May 8th for about $99. What do you think of that trade?
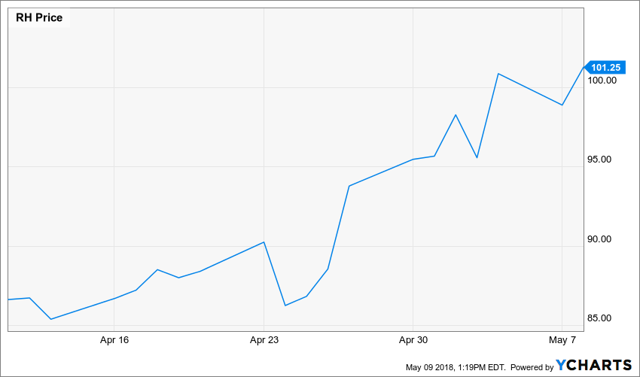
BH: Interesting. Looks like you turned a healthy profit on the trade. I know you like to buy stocks in the lower end of a rising channel. But why’d you sell?
Road Runner: That’s exactly right, I do like to buy stock in the lower end of a rising channel. And my holding period is usually time-based. Four weeks is my typical holding period and that time was up.
BH: So you don’t like RH as a long-term investment? What do you think of the fundamentals? Here is a look at the Fast Graph.
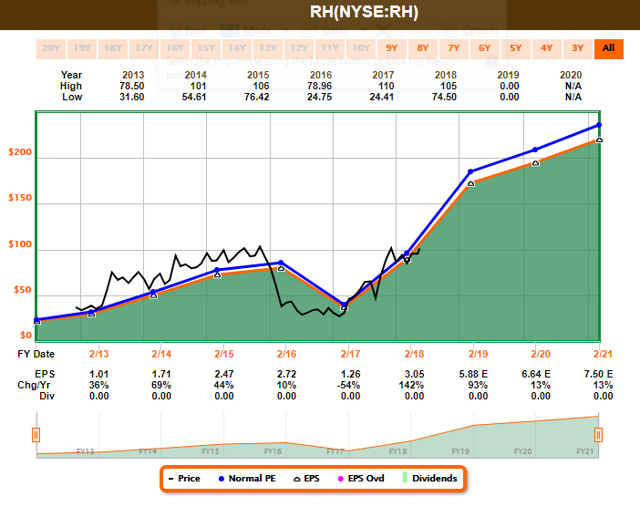
Road Runner: You know perfectly well I am a technical trader, and the fundamentals are not the driving factor behind my trades. As you recall, the fundamentals were looking terrible for RH last year, but we still achieved a great return on this trade too: Despite Fundamentals, We Nailed RH, Again.
BH: Alright, nice trade RoadRunner, but don’t get too braggadocious, I can see your track record in the earlier table in this report. You’re doing fine, but not as good as the other trading models.
Road Runner: My style is holding up just fine in this market, it combines well with other models to lower volatility, and when my style is back in full favor with the market then my returns will be even better.
BH: Thanks Road Runner. How about you, Felix—anything to share this week?
Felix: Yes. This week I am sharing my top 20 ranked stocks among the S&P 500. Here is the list.
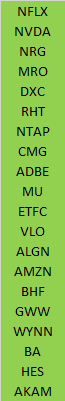
BH: That is interesting—thanks for sharing. Based on your top ranked stocks, Netflix (NFLX) and Nvidia (NVDA) it’s easy to image you are a momentum trader, correct?
Felix: Correct. I am a momentum trader. However, my typical holding period is around 66 weeks, on average—much longer than the other traders. I use price targets, macro factors and stops to exit.
BH: Well based on the performance table earlier in this report, you momentum style has been doing very well over the last year, and so have you.
Felix: thanks. How about you Oscar, any trades this week?
Oscar: No trades, but I did rank my top 20 ETFs from among our universe of High Liquidity ETFs with price volume multiples of over $100 million per day. Here is the list.
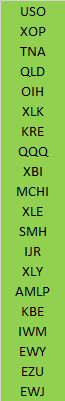
BH: It doesn’t surprise me in the least that Oil (USO) is at the top of your list. This ETF has ranked near the top of your list multiple times in recent months, and you’ve been right as oil prices continue to rally. Let me guess—you too are a momentum trader?
Oscar: Yes. And just so you know, my version of momentum is more complicated than simply securities that have been rallying, but you have the general idea right. I usually hold for about 6-weeks before rotating into a different sector, per my model rankings.
Conclusion:
While drawing lines on charts is not a strategy, it can help you visualize your trading strategies. Our trading models use a variety of strategies as described in this article and as described in the Stock Exchange Character Guide (later in this report). Momentum strategies have been increasingly popular, and our momentum based trading models continue to perform well. However, we prefer to use a blended approach that combines momentum and “dip buying” because it helps us keep returns high and volatility relatively lower.
Background On The Stock Exchange:
Each week, Felix and Oscar host a poker game for some of their friends. Since they are all traders, they love to discuss their best current ideas before the game starts. They like to call this their “Stock Exchange.” (Check out Background on the Stock Exchange for more background). Their methods are excellent, as you know if you have been following the series. Since the time frames and risk profiles differ, so do the stock ideas. You get to be a fly on the wall from my report. I am usually the only human present and the only one using any fundamental analysis.
The result? Several expert ideas each week from traders, and a brief comment on the fundamentals from the human investor. The models are named to make it easy to remember their trading personalities.
Stock Exchange Character Guide:
| Character | Universe | Style | Average Holding Period | Exit Method | Risk Control |
| Felix | NewArc Stocks | Momentum | 66 weeks | Price target | Macro and stops |
| Oscar | “Empirical” Sectors | Momentum | Six weeks | Rotation | Stops |
| Athena | NewArc Stocks | Momentum | 17 weeks | Price target | Stops |
| Holmes | NewArc Stocks | Dip-buying Mean reversion | Six weeks | Price target | Macro and stops |
| RoadRunner | NewArc Stocks | Stocks at bottom of rising range | Four weeks | Time | Time |
| Jeff | Everything | Value | Long term | Risk signals | Recession risk, financial stress, Macro |
We have a new (free) service to subscribers to our Felix/Oscar update list. You can suggest three favorite stocks and sectors. We report regularly on the “favorite fifteen” in each ...
more

