
State Of The Markets: New Information
Last week, we looked at three key issues that the stock market seemed to be struggling with: (1) The possibility of the Fed "tapering" their bond-buying program earlier than expected, (2) the potential for inflation to become ingrained (a.k.a. non-transitory), and (3) the unavoidable slowdown in economic/earnings growth that will be coming down the pike in the coming quarters.
In light of the fact that stocks went nowhere on the week - albeit in a sometimes-violent fashion, I'm going to suggest that investors continued to struggle with the aforementioned issues. Thus, I think we can agree that the major indices remain in a consolidation phase.
The next question, of course, is: what comes next? Typically, stocks tend to exit a consolidation phase heading in the same direction they were moving when the sideways action began. As such, one can argue that the next important move ought to be higher. However, such a move would require the market to come to grips with the issues it is currently working through.
On that score, markets did receive some new information last week, as the minutes from the April FOMC meeting stated that the members of the committee have indeed started talking about tapering the pace of bond buying. The actual language was relatively benign, as the minutes stated:
"A number of participants suggested that if the economy continued to make rapid progress toward the Committee’s goals, it might be appropriate at some point in upcoming meetings to begin discussing a plan for adjusting the pace of asset purchases."
This makes perfect sense. After all, the economy is improving at a faster rate than had been expected. Therefore, if GDP growth continues apace, it would be logical for the Fed to start talking about tapering, right?
However, one thing I've learned over the years is that markets don't like surprises. And to be sure, this was a surprise. So naturally, rates spiked up on the news, the dollar fell, and the probability of a rate hike within the next year moved up on the week as traders started digesting/discounting the change to the Fed landscape.
The minutes also contained a little something for stock market bears as FOMC members expressed some concern about the perceived risks in the market. For example, the minutes included the following: "...risk appetite in capital markets was elevated, as equity valuations had risen further, IPO activity remained high, and risk spreads on corporate bonds were at the bottom of their historical distribution."
Reading on, it appears there was also some concern about the Fed "overdoing it" as they have in the past. According to the minutes:
"Various participants commented on the prolonged period of low interest rates and highly accommodative financial market conditions and the possibility for these conditions to lead to reach-for-yield behavior that could raise financial stability risks."
The good news is that stocks didn't crater on the news. Sure, there was some volatility around the announcement, but that is to be expected in a world where algos react to headlines at the speed of light, and then humans ask questions later. Thus, I can argue that the market handled the modest shift in the Fed's official stance fairly well.
Perhaps the reason stocks held up nicely was the big batch of record-breaking economic data we've seen lately. Examples of data points reaching record levels include (Source: Ned Davis Research):
- Used car prices rose a record 54.2% year-over-year.
- The ratio of Vehicle Inventories to Sales hit a record low.
- Weekly aggregate payrolls increased the most on record.
- The Employment Trends Index rose a record amount.
- Job Openings hit a record-high.
- Global PMI sported a record annual gain.
- The annual change for the OECD's Leading Indicator came in at a record high.
- Record high for for Existing Home Sales and Prices.
- Record high for year-over-year Retail Sales.
Granted, a lot of the "records" being set are due to the fact that the economy was in lockdown one year ago. As such, the comps represent a very low bar. However, we must also recognize that the improvements have been largely above expectations across the board and have occurred earlier than expected.
My take is that the good news continues to counter the bad. As in the state of the economy trumps the idea that the Fed will start reducing the amount of bonds they are buying a few months earlier than the consensus had expected. As such, my view is that while stocks may continue to struggle for a while as the markets work through these issues, there may still be some upside on the back of the impressive economic expansion, assuming it continues, that is.
Next week, we will look at what the historical cycles have to say about what could come next. Spoiler alert: The cycles suggest things could get better before reality sets in later in the summer. Now let's turn to our weekly model update.
The Big-Picture Market Models
We start with six of our favorite long-term market models. These models are designed to help determine the "state" of the overall market.
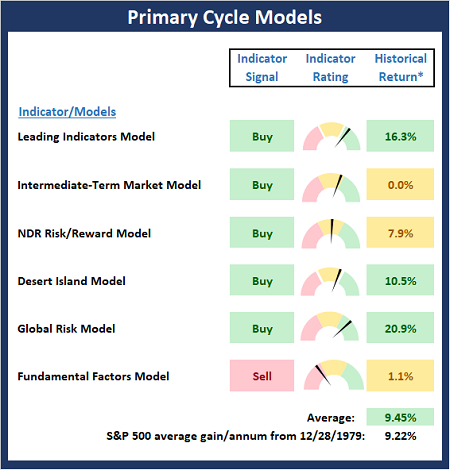
Source: Ned Davis Research (NDR) as of the date of publication. Historical returns are hypothetical average annual performances calculated by NDR.
The Fundamental Backdrop
Next, we review the market's fundamental factors including interest rates, the economy, earnings, inflation, and valuations.
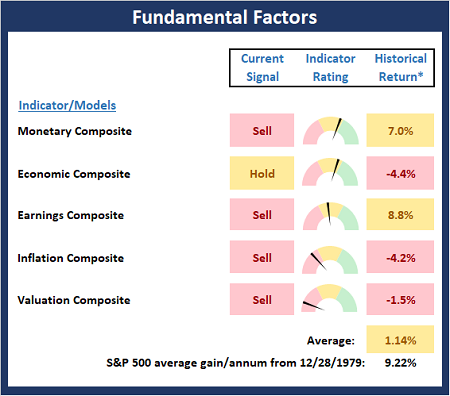
Source: Ned Davis Research (NDR) as of the date of publication.
The State of the Trend
After reviewing the big-picture models and the fundamental backdrop, I like to look at the state of the current trend. This board of indicators is designed to tell us about the overall technical health of the market's trend.
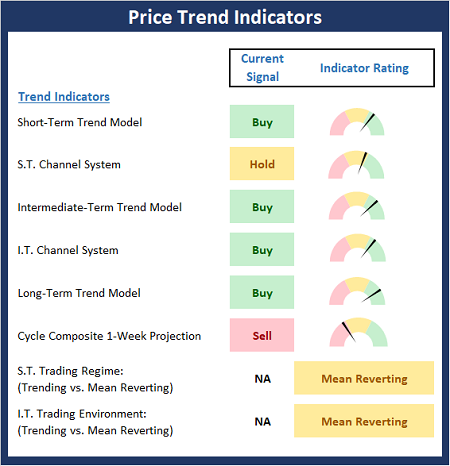
Source: Ned Davis Research (NDR) as of the date of publication.
The State of Internal Momentum
Next, we analyze the momentum indicators/models to determine if there is any "oomph" behind the current move.
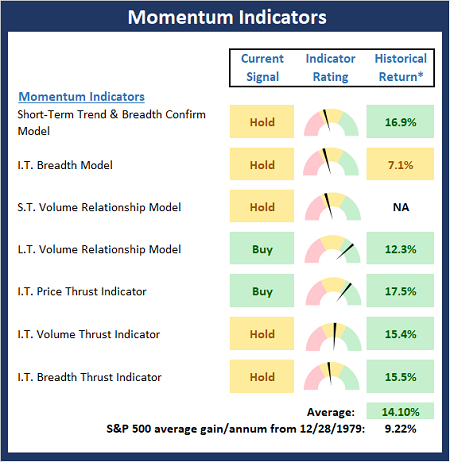
Source: Ned Davis Research (NDR) as of the date of publication.
Early Warning Signals
Finally, we look at our early warning indicators to gauge the potential for counter-trend moves. This batch of indicators is designed to suggest when the table is set for the trend to "go the other way."
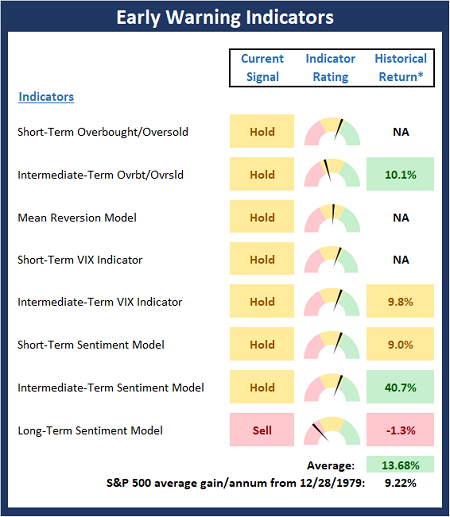
Source: Ned Davis Research (NDR) as of the date of publication.
Disclosure: At the time of publication, Mr. Moenning held long positions in the following securities mentioned: None - Note that positions may change at any time.
The opinions and forecasts ...
more

