
SPY Appears To Be Stalling
- SPX Monitoring purposes; Flat.
- Monitoring purposes Gold: Long GDX on 1/29/19 at 21.96.
- Long-Term Trend SPX monitor purposes; Long SPX on 10/14/19 at 2966.15.
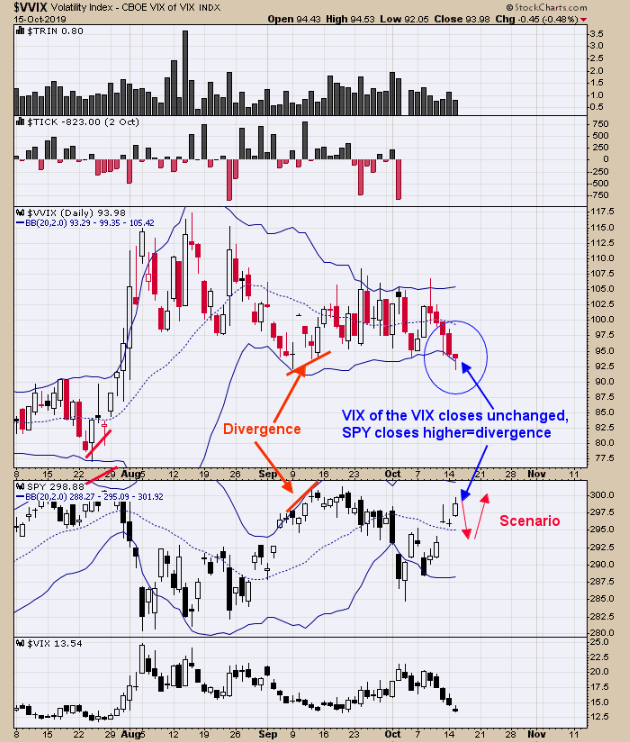
Above is the chart of the VVIX. The VVIX trades opposite of the SPY. Today, the SPY was nearly up by 1% of the VVIX which in turn was nearly unchanged and with a short-term divergence on its back. SPY gapped up on Friday and with this divergence, it may mean that Friday’s gap may be tested before heading higher. The intermediate-term trend appears to be up but a short-term pullback is still possible. Long-Term Trend SPX monitor purposes; Long SPX on 10/14/19 at 2966.15.
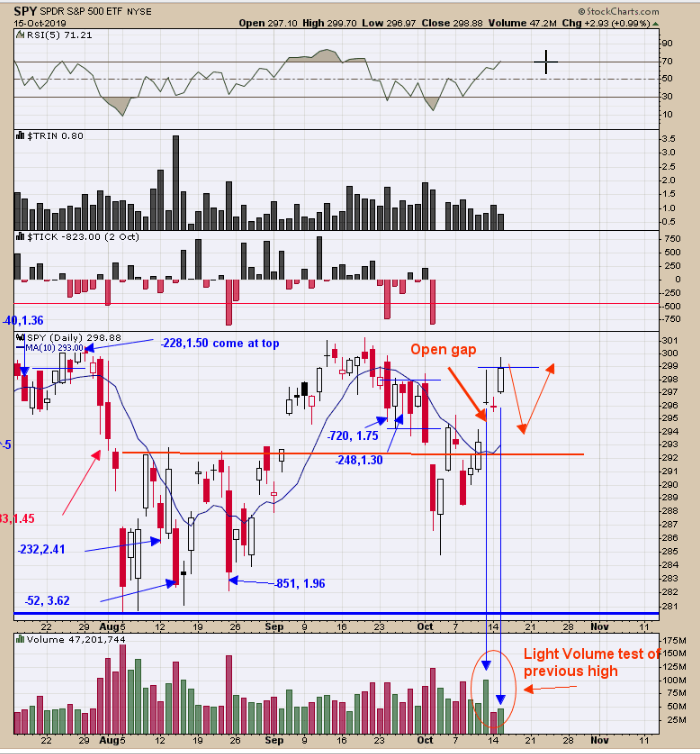
Today’s rally tested last Friday’s high on less than half the volume. The test of a previous high on light volume is indicating a bearish sign and suggests that the previous high has had resistance. If we are to go step further, a test of a previous high on 50% lighter volume compared to a test on 10% lighter volume can tell us that the 50% lighter volume test shows much more weakness as the volume is energy and less energy means less force to push through the previous high. SPY appears to be stalling here for a test of Friday’s gap.
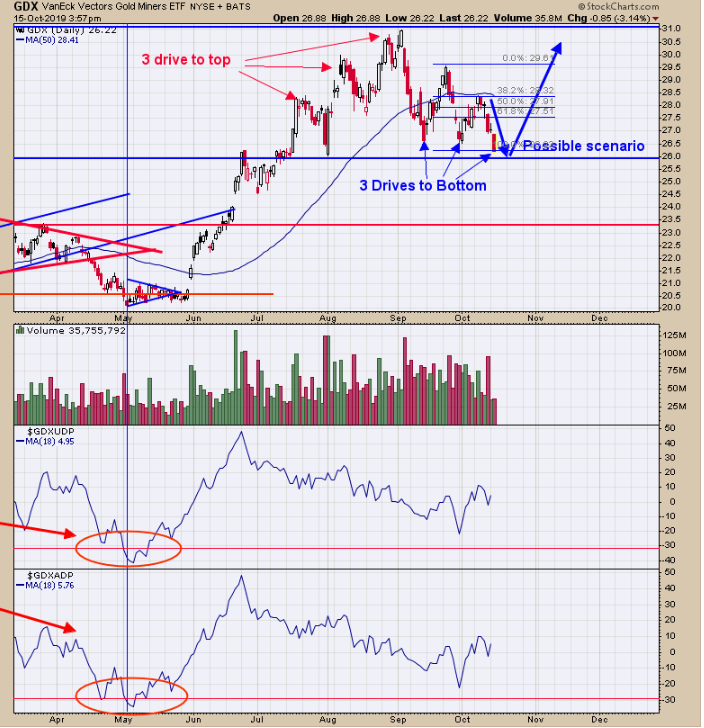
In an October 10th report, we said, “Going into the early September high, a pattern called “Three Drive to Top” formed. This pattern can be identified when the second decline off the second top retraces at least 61.8%, which in turn this one did. The market then rallies to a third top. Form there, the third top market usually retraces back to where the pattern began. In this case, a pullback to the 26.00 level was its target. Since the beginning of September, GDX is now drawing a “Three Drives to Bottom pattern”.The same setup but in reverse, this pattern can be identified when the second rally off the second bottom retraces at least 61.8%, which in turn this one did. The market then declines to a third bottom. Form the third-bottom, the market usually retraces back to where the pattern began (in this case a rally to 30.00 range). Since the weekly and monthly chart remains bullish, we would expect GDX to continue its rally higher and therefore it is possible to break to new highs. Long GDX on 1/29/19 at 21.97.
Disclaimer: Signals are provided as general information only and are not investment recommendations. You are responsible for your own investment decisions. Past performance does not guarantee future ...
more

