
Speculator Extremes: Soybean Meal & Wheat Lead Most Bullish & Bearish Positions
The latest update for the weekly Commitment of Traders (COT) report was released by the Commodity Futures Trading Commission (CFTC) on Friday for data ending on December 6th.
This weekly Extreme Positions report highlights the Most Bullish and Most Bearish Positions for the speculator category. Extreme positioning in these markets can foreshadow strong moves in the underlying market.
To signify an extreme position, we use the Strength Index (also known as the COT Index) of each instrument, a common method of measuring COT data. The Strength Index is simply a comparison of current trader positions against the range of positions over the previous 3 years. We use over 80 percent as extremely bullish and under 20 percent as extremely bearish.
Compare Strength Index scores across all markets in the data table or cot leaders table.
Here Are This Week’s Most Bullish Speculator Positions:
Soybean Meal
(Click on image to enlarge)
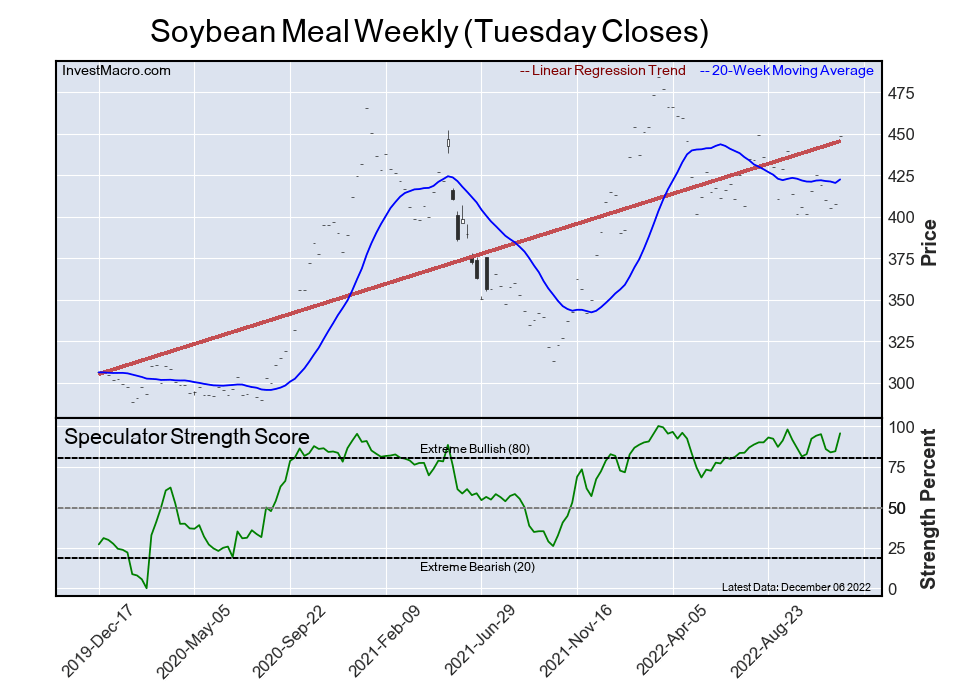
The Soybean Meal speculator position comes in as the most bullish extreme standing this week. The Soybean Meal speculator level is currently at a 95.5 percent score of its 3-year range.
The overall net speculator position totaled 122,174 net contracts this week with a gain of +19,835 contract in weekly speculator bets.
Bloomberg Commodity Index
(Click on image to enlarge)
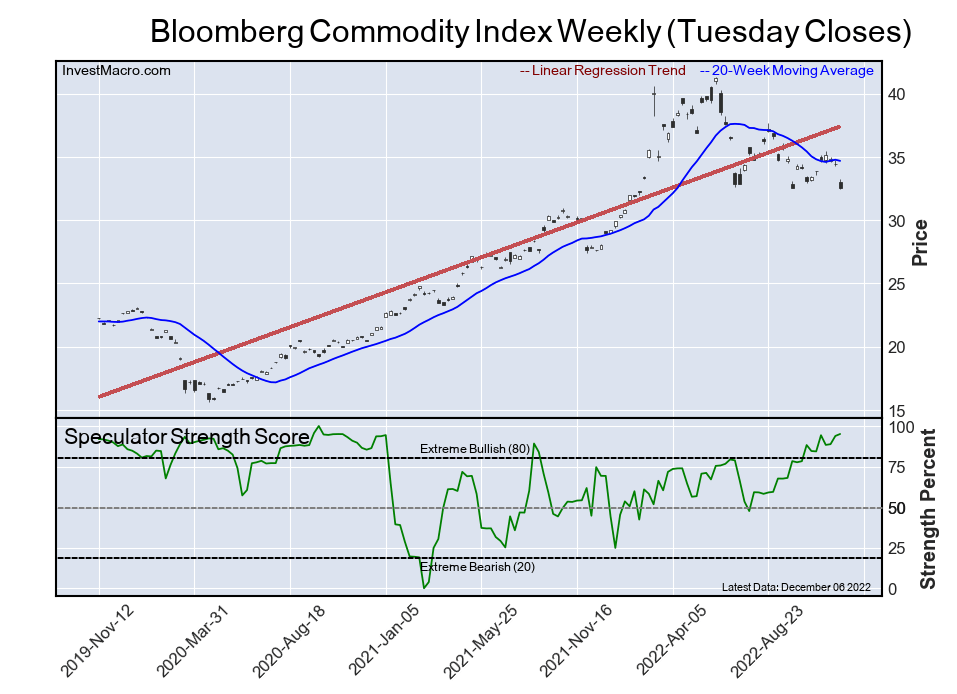
The Bloomberg Commodity Index speculator position comes next in the extreme standings this week. The Bloomberg Commodity Index speculator level is now at a 95.1 percent score of its 3-year range.
The speculator position was -3,239 net contracts this week with a change of +320 contract in this week’s speculator bets.
Nasdaq
(Click on image to enlarge)
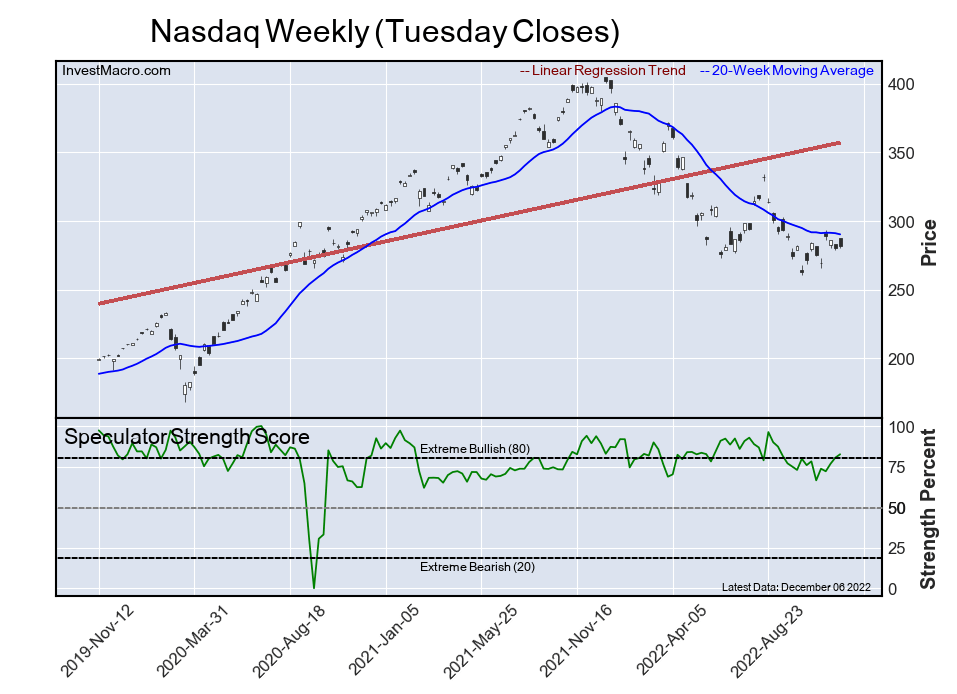
The Nasdaq speculator position comes in third this week in the extreme standings. The Nasdaq speculator level resides at a 82.6 percent score of its 3-year range.
The speculator position was 13,517 net contracts this week with a gain of +3,762 contract in this week’s speculator positions.
Bitcoin
(Click on image to enlarge)
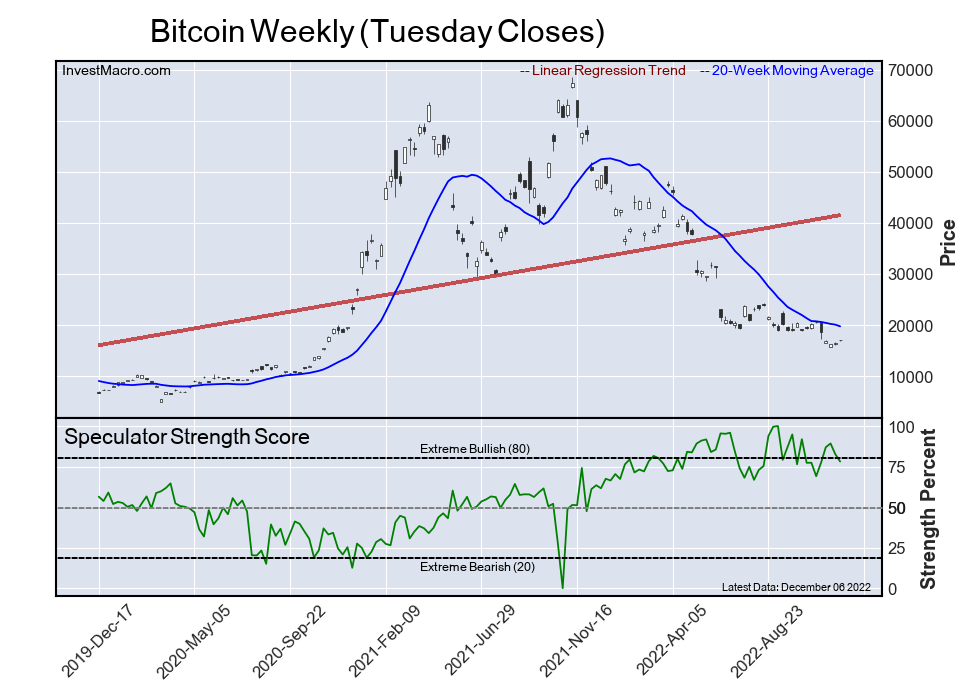
The Bitcoin speculator position comes up number four in the extreme standings this week. The Bitcoin speculator level is at a 78.1 percent score of its 3-year range.
The speculator position was 67 net contracts this week although with a drop of -257 contract in this week’s speculator positions.
This Week’s Most Bearish Speculator Positions:
Wheat
(Click on image to enlarge)
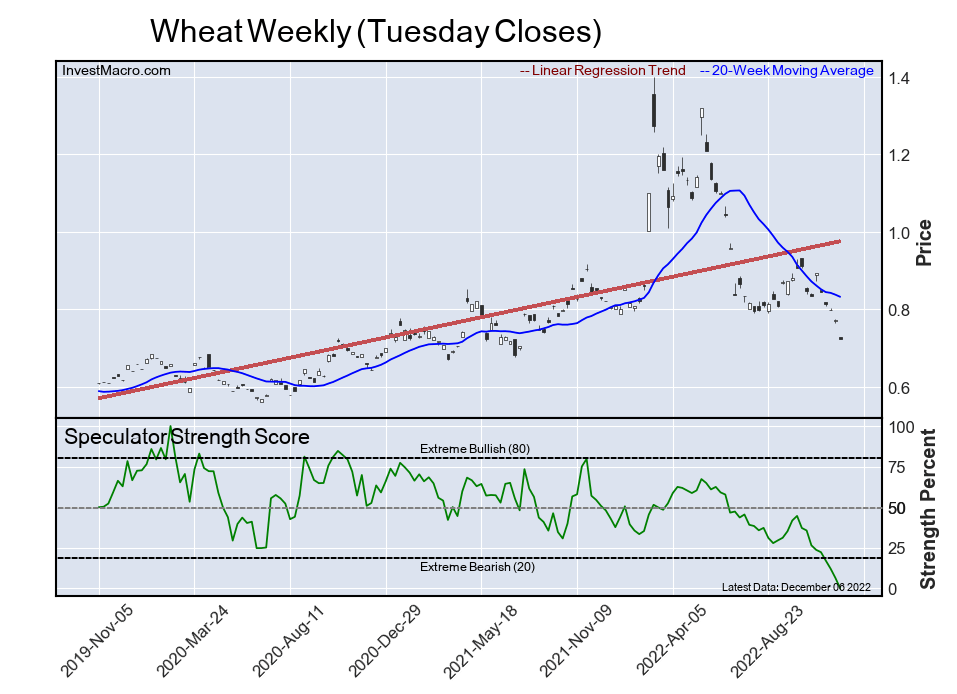
The Wheat speculator position comes in as the most bearish extreme standing this week. The Wheat speculator level is at a 0.0 percent score of its 3-year range.
The speculator position was -39,897 net contracts this week with a -6,592 contract decline in speculator bets.
5-Year Bond
(Click on image to enlarge)
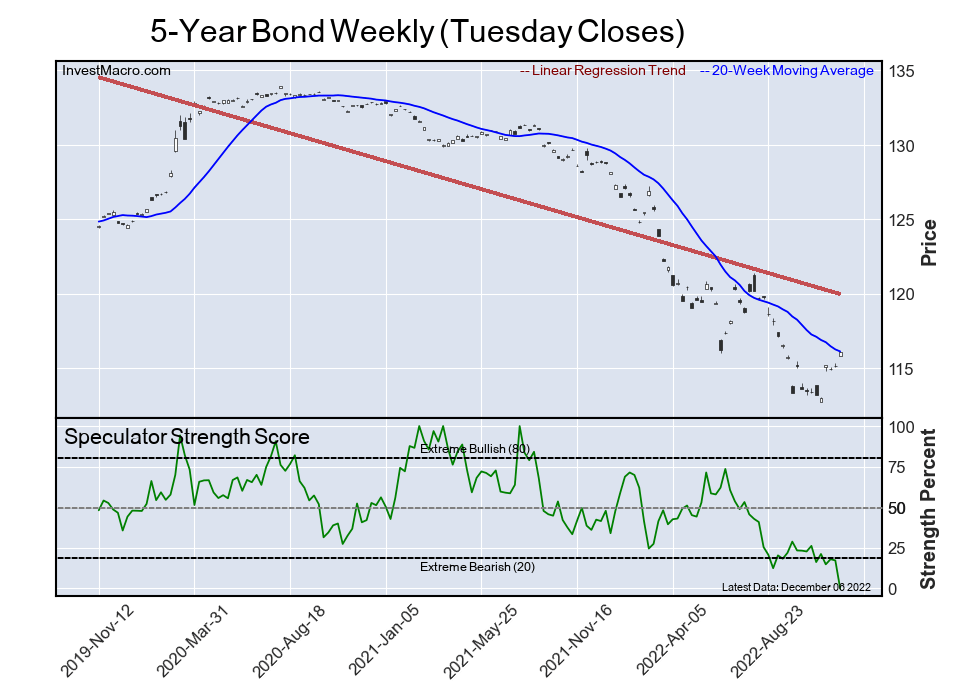
The 5-Year Bond speculator position comes in next for the most bearish extreme standing on the week. The 5-Year Bond speculator level is also at a 0.0 percent score of its 3-year range.
The speculator position was -658,606 net contracts this week with a significant drop of -129,257 contract in this week’s speculator positions.
Ultra 10-Year U.S. T-Note
(Click on image to enlarge)
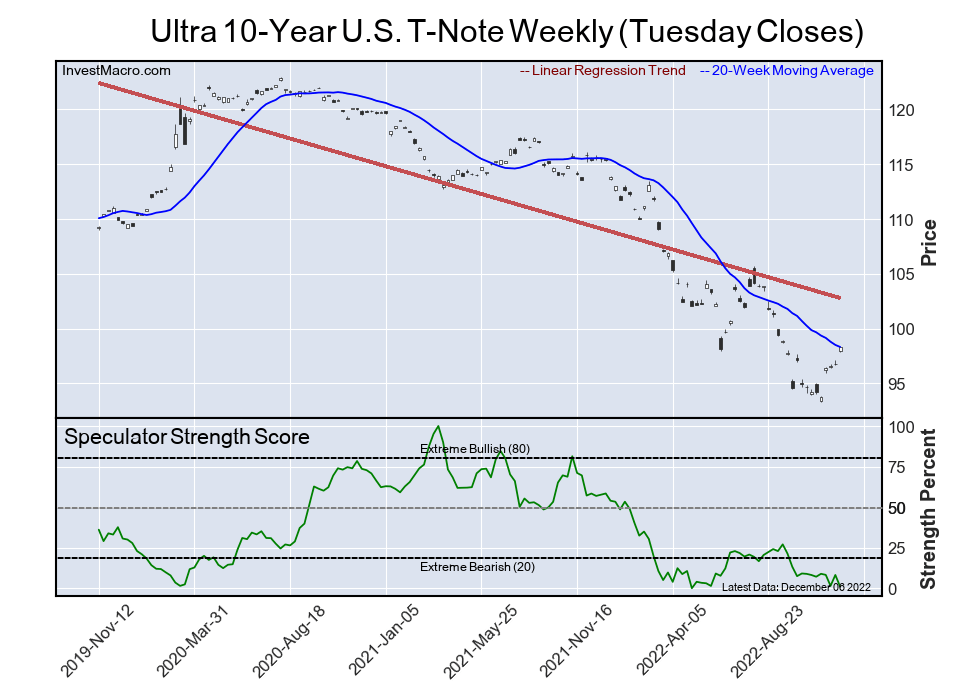
The Ultra 10-Year U.S. T-Note speculator position comes in as third most bearish extreme standing of the week. The Ultra 10-Year U.S. T-Note speculator level resides at a 1.0 percent score of its 3-year range.
The speculator position was -106,952 net contracts this week with a decline of -27,703 contract in this week’s speculator positions.
Coffee
(Click on image to enlarge)
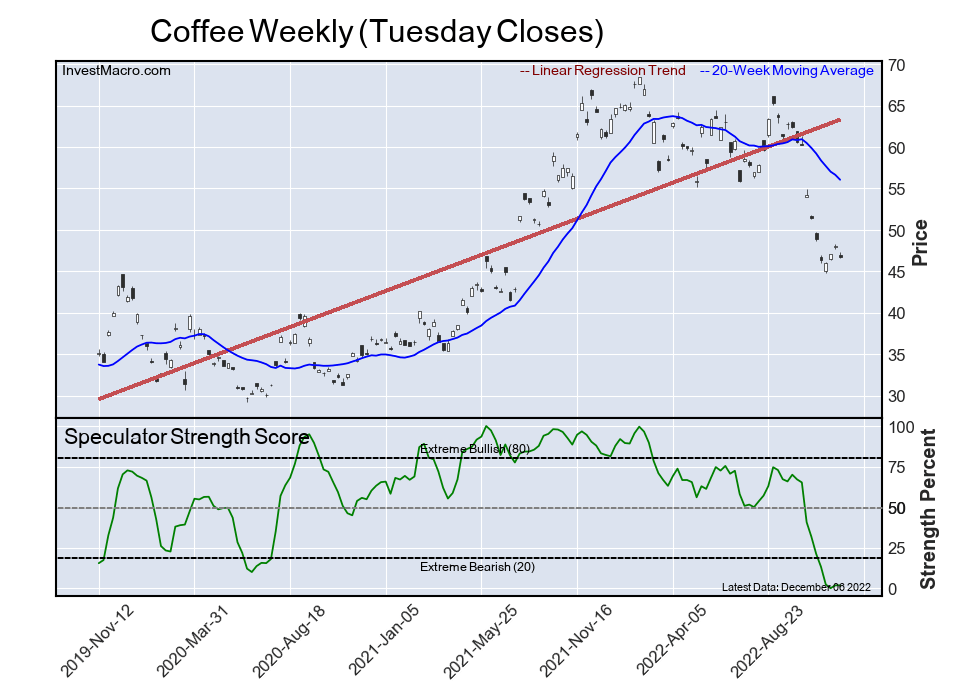
The Coffee speculator position comes in as this week’s fourth most bearish extreme standing. The Coffee speculator level is at a 1.8 percent score of its 3-year range.
The speculator position was -14,642 net contracts this week with a small -6 contract change in the weekly speculator bets.
WTI Crude Oil
(Click on image to enlarge)
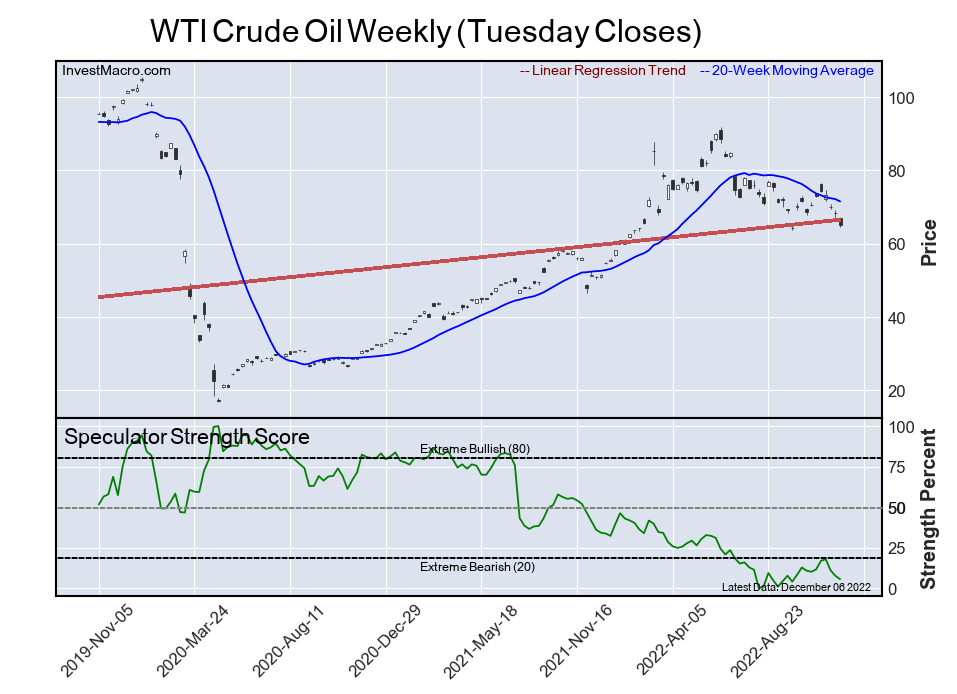
Finally, the WTI Crude Oil speculator position comes in as the fifth most bearish extreme standing for this week. The WTI Crude Oil speculator level is at a 5.6 percent score of its 3-year range.
The speculator position was 231,720 net contracts this week with a weekly -8,019 contract shortfall in speculator bets.
Article By InvestMacro – Receive our weekly COT Newsletter
*COT Report: The COT data, released weekly to the public each Friday, is updated through the most recent Tuesday (data is 3 days old) and shows a quick view of how large speculators or non-commercials (for-profit traders) were positioned in the futures markets.
The CFTC categorizes trader positions according to commercial hedgers (traders who use futures contracts for hedging as part of the business), non-commercials (large traders who speculate to realize trading profits) and nonreportable traders (usually small traders/speculators) as well as their open interest (contracts open in the market at time of reporting). See CFTC criteria here.
More By This Author:
COT Speculator Extremes: Bloomberg Commodity Index, Wheat Lead Weekly Bullish & Bearish Positions
Currency Speculators Up Their Mexican Peso Bets Higher For 8th Time In 9 Weeks
COT Bonds Speculators Trim Their Eurodollar Bearish Bets
Disclosure: Foreign Currency trading and trading on margin carries a high level of risk and can result in loss of part or all of your investment.Due to the level of risk and market volatility, ...
more

