
S&P And Dow Jones Islamic Market Indices Largely Outperformed Conventional Indices In Q2 2019
Developed Market Indices Continued to Outperform Conventional Indices, Emerging Markets Lagged
Global S&P and Dow Jones Shariah-compliant benchmarks outperformed their conventional counterparts YTD in 2019, as Information Technology—which tends to be overweight in Islamic indices—has been a sector leader, while Financials—which is underrepresented in Islamic indices—continued to underperform the broader market. The S&P Global BMI Shariah and Dow Jones Islamic Market (DJIM) World gained 18.4% and 18.0% YTD, respectively, outperforming the conventional S&P Global BMI by approximately 200 bps.
(Click on image to enlarge)

The outperformance trend played out across major regions as Shariah-compliant benchmarks measuring U.S., Europe, Asia Pacific, and developed markets each continued to outperform conventional equity benchmarks by meaningful margins. Emerging markets and the Pan Arab region were exceptions, as Shariah-compliant benchmarks in these regions underperformed their conventional counterparts.
U.S. Equities Led the Rest of the World through Q2 2019
Following robust gains in Q1 2019, positive U.S. equity performance continued throughout Q2 2019, leading conventional global equities YTD. A continued dovish stance from the U.S. Federal Reserve and hopes of relief in U.S.-China trade negotiations helped push U.S. equities higher last quarter. European and Asia Pacific equities followed in performance, as each enjoyed healthy gains over the period.
(Click on image to enlarge)

MENA Equities Underperformed – Country Results Varied
MENA equities, as measured by the S&P Pan Arab Composite, lagged marginally behind emerging market equities YTD, with a gain of 12.2%. Following robust Q1 2019 performance, the S&P Bahrain continued to lead the region YTD, with gains of 25.1%, followed by the S&P Egypt BMI, which added 22.0%. The S&P Saudi Arabia, which was promoted to emerging market status in March 2019, gained a favorable 15.9%. The S&P Oman lagged most, falling 2.6% YTD, followed by the S&P Qatar, which rose 1.6% YTD.
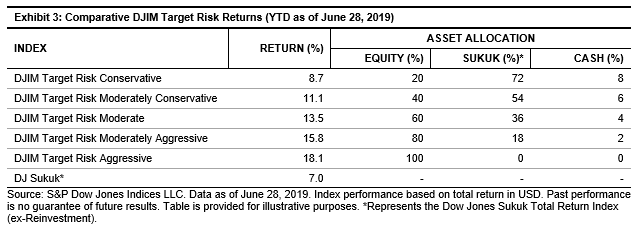
Varied Returns of Shariah-Compliant Multi-Asset Indices
The DJIM Target Risk Indices—which combine Shariah-compliant global core equity, sukuk, and cash components—generally underperformed the S&P Global BMI Shariah and DJIM World YTD. Performance of the comparably more risk-averse DJIM Target Risk Conservative Index was constrained by its 20% allocation to global equities in the expanding market environment, and the index ultimately gained 8.7% YTD. Meanwhile, the performance of the DJIM Target Risk Aggressive Index was driven by its 100% allocation to a mix of Shariah-compliant global equities, with the index returning 18.1% YTD, in alignment with the broader S&P Global BMI Shariah and DJIM World.
(Click on image to enlarge)
For more information on how Shariah-compliant benchmarks performed in Q2 2019, read our latest Shariah Scorecard.
Copyright © 2018 S&P Dow Jones Indices LLC, a division of S&P Global. All rights reserved. This material is reproduced with the prior written consent of S&P DJI. For more information ...
more

