
S&P 500 Snapshot: Up 2.75% YTD
The S&P 500 started the week out fairly steady, only to drop upon opening Thursday, September 17. The index continued its decline on Friday, September 18, only to bounce back slightly at close. It is down 1.12% from Thursday, 2.75% YTD, and is 7.3% below its record close.
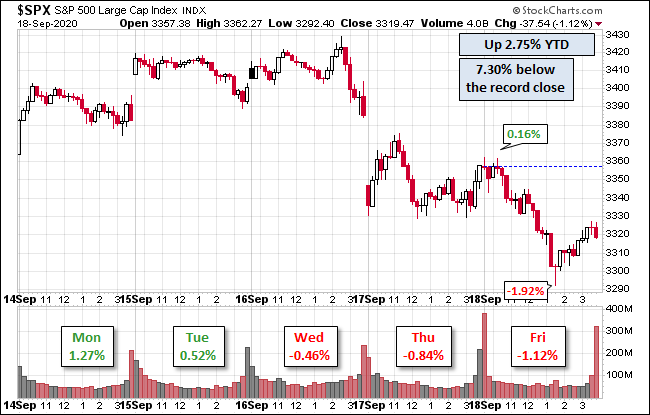
The U.S. Treasury puts the closing yield on the 10-year note as of September 18 at 0.70%, which is above its record low (0.52% on August 4). The two-year note is at 0.14%.

Here's a snapshot of the index going back to 2011.

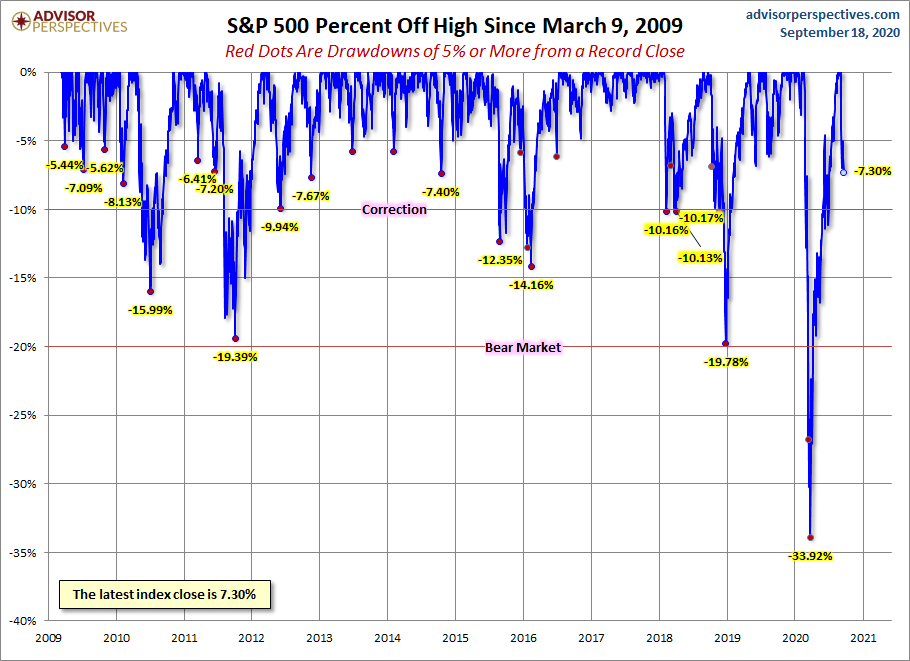
A Perspective on Drawdowns
Here's a snapshot of record highs and selloffs since the 2009 trough.
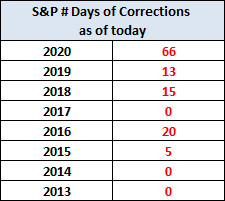
Here's a table with the number of days of a 1% or more change in either direction, and the number of days of corrections (down 10% or more from the record high) going back to 2013.

Here is a more conventional log-scale chart with drawdowns highlighted.

Here is a linear scale version of the same chart with the 50- and 200-day moving averages.

A Perspective on Volatility
For a sense of the correlation between the closing price and intraday volatility, the chart below overlays the S&P 500 since 2007 with the intraday price range. We've also included a 20-day moving average to help identify trends in volatility.


