
S&P 500 Sector Performance - 2019 Vs. 2018
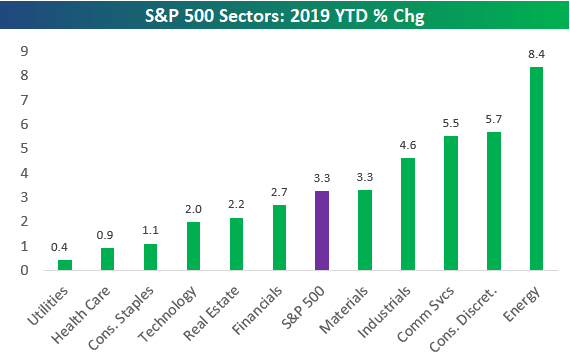
The S&P 500 was up 3.3% YTD as of mid-day today. As shown below, Energy has been by far the best sector so far this year with a gain of 8.4%. Consumer Discretionary ranks 2nd with a gain of 5.7%, followed closely by Communication Services in 3rd with a gain of 5.5%. Industrials and Materials are the other two sectors that have outperformed the S&P 500.
While all eleven sectors are in the black for the year, Utilities and Health Care have lagged the market with gains of less than 1%. Note that the Tech sector — the largest sector of the market — is up 2% YTD, which is 130 basis points less than the S&P 500.
(Click on image to enlarge)
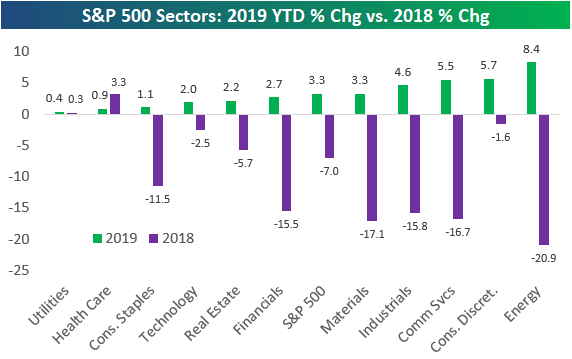
The chart below compares 2019 YTD performance with the change seen in 2018. Utilities and Health Care were the best performing sectors of 2018 and the only two sectors that were up on the year. These two sectors have taken a breather so far in 2019 as the weakest performers.
Generally speaking, the sectors that did the best in 2018 have underperformed so far this year, while the sectors that did the worst in 2018 have bounced the most. Energy was the worst sector of 2018 and is the best so far in 2019. The big exception is Consumer Discretionary, which only fell 1.6% for the full year 2018 and is up 5.7% in 2019 — good for second best so far this year.
(Click on image to enlarge)
Disclaimer: To begin receiving both our technical and fundamental analysis of the natural gas market on a daily basis, and view our various models breaking down weather by natural gas demand ...
more

