
S&P 500 Performance Breakdown: 2020
Amazingly, the average stock in the S&P 500 is now up 54.7% since the March 23rd COVID-Crash closing low for the index. From the high on February 19th through the low on March 23rd, the average stock in the S&P fell 39.13%. On a year-to-date basis, the average stock is down just 5.13%, while the average stock is down 9.06% since the February 19th all-time closing high in the index.
Here are two other stats that are pretty mind blowing. First, there is only one stock (COTY) in the entire S&P 500 that’s down since March 23rd, and it’s down less than 2%. Second, there are only eight stocks that aren’t up more than 10% since March 23rd, and these include names like Walmart (WMT), Costco (COST), and Kroger (KR).
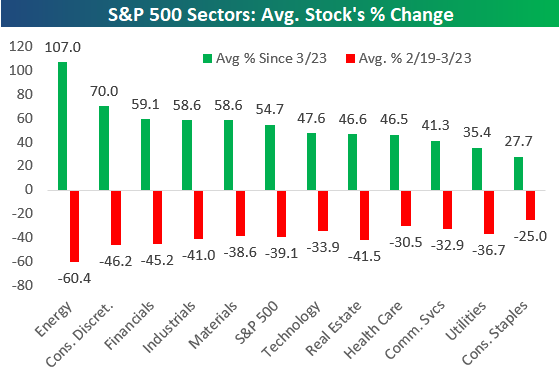
Looking at the eleven S&P 500 sectors, the average Energy sector stock is up more than 107.05% since March 23rd. Note, however, that these Energy stocks are still down nearly 30% year-to-date because they fell 60% from February 19th through March 23rd. Consumer Discretionary, Financials, Industrials, and Materials all have average gains of more than 50% since March 23rd, as well.
The average Tech and Health Care stock is now up year-to-date, while most other sectors have average declines of 3-6% at this point.

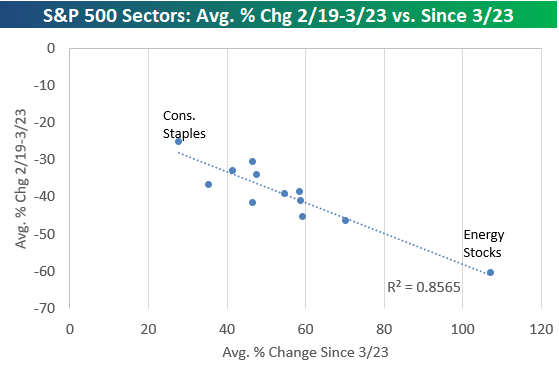
Below is a chart showing the average stock’s gain since March 23rd by sector versus the average stock’s decline from February 19 through March 23. In the second chart, we show a scatter plot of the same performance numbers. Basically the sectors that fell the most have rallied back the most, and the ones that fell the least have rallied back the least. The r-squared here is 0.85, which is very high.
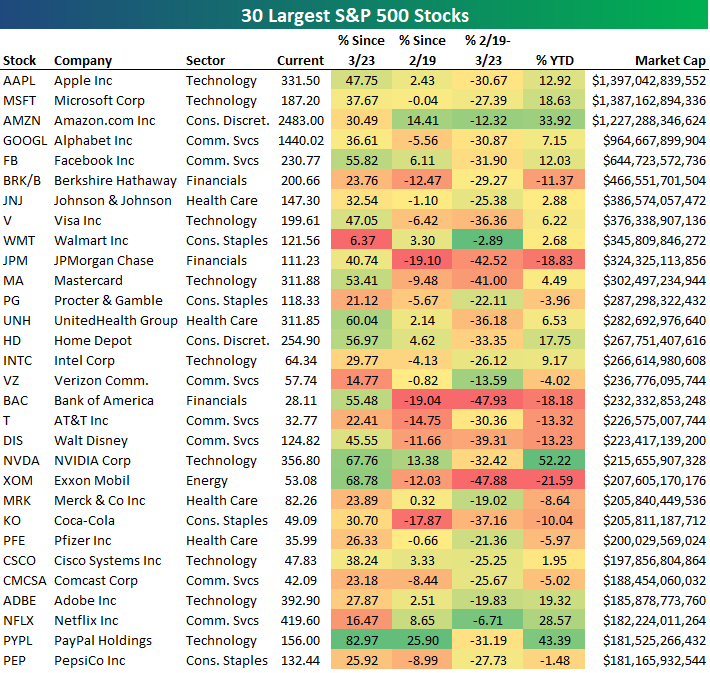
Below is a table showing the recent performance of the 30 largest stocks in the S&P 500. As shown, Apple (AAPL) is back on top with a market cap that’s $10 billion more than Microsoft (MSFT), while Amazon (AMZN) ranks third at $1.227 trillion. Alphabet (GOOGL) is back up 7.15% on the year, which leaves its market cap only $35.5 billion away from the “trillion dollar club.”
The biggest winners YTD on this list are Amazon, NVIDIA (NVDA), Netflix (NFLX), and PayPal (PYPL).PayPal is now the 29th largest stock in the S&P with a market cap of $181.5 billion.
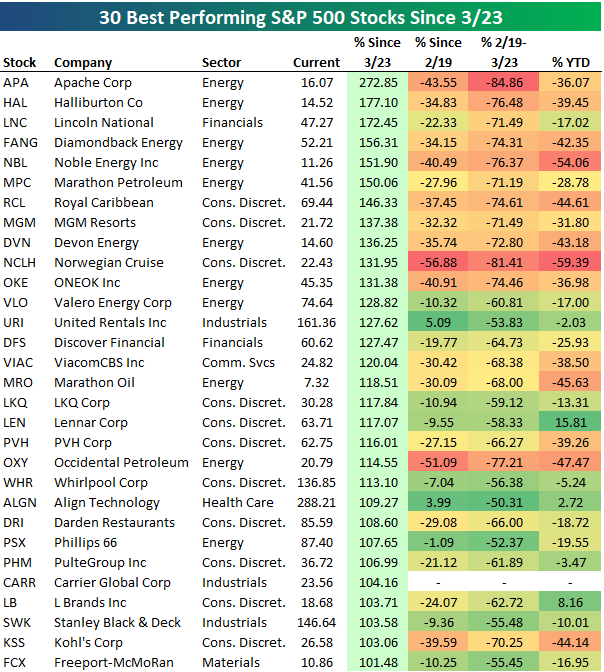
Below is a list of the 30 best performing S&P 500 stocks since the March 23 closing low for the index. As shown, all 30 stocks are up more than 100%, with Apache (APA) up the most at 272.85%. Halliburton (HAL) is up the second most at +177%, followed by Lincoln National (LNC) at +172.45%. APA is still down 36% YTD, while HAL is down 39.45%, and LNC is down 17%.
While there are many stocks on the list that are still down significantly year-to-date, there are others like Lennar (LEN), Align Tech (ALGN), and L Brands (LB) that are now up YTD after rallying more than 100% since March 23.
All 30 of these stocks were down more than 50% from February 19 to March 23, as well.
Below are the 30 S&P 500 stocks that are now up the most on a year-to-date basis.
These stocks are all up more than 23% YTD, with DexCom (DXCM) leading the way at +66.55%.Regeneron (REGN), NVIDIA, ABIOMED (ABMD), and PayPal round out the top five with gains of more than 43%. Other notables on the list of 2020’s biggest winners include ServiceNow (NOW), eBay (EBAY), Old Dominion Freight (ODFL), Amazon, Netflix, Clorox (CLX), and Domino’s Pizza (DPZ).

Disclaimer: To begin receiving both our technical and fundamental analysis of the natural gas market on a daily basis, and view our various models breaking down weather by natural gas demand ...
more

