
S&P 500 Inductees: Class Of 2020
With Tesla (TSLA) set to be the next stock to join the S&P 500 in a little over a month, it will be the 20th change to the index (addition or removal of a stock) of 2020. That is basically in line with the average number of changes per year over the past decade (20.7). Of the current members of the S&P 500, 191 have entered the index since the start of 2010.
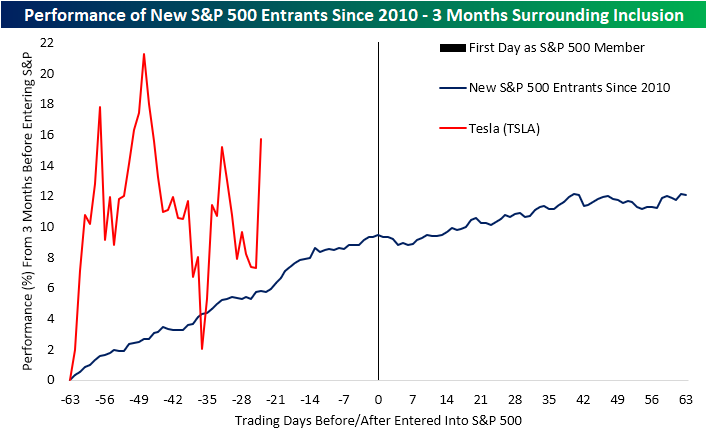
Below we show a chart from last night’s Closer depicting the performance of the stocks that have entered the S&P 500 in the past decade beginning three months before their entrance date (day number zero is the first day as an S&P 500 member) to three months after. As shown, historically over the past decade, new entrants to the large-cap benchmark have on average risen in the months leading up to inclusion. In the immediate days following inclusion, there is some sideways to slight downward movement but that is followed by a turn higher.
In the chart below we show the performance of just the stocks that have been included in the index since the start of 2020 from the close before the first day they trade as an S&P 500 stock through three months out. While it has not been a full three months since some of these have been added (i.e. Teradyne (TER), Catalent (CTLT), Etsy (ETSY), Pool Corp (POOL), and Vontier (VNT)), the average performance of three months after inclusion has been a gain of 11.5%. Carrier Global (CARR), which was spun off of United Technologies (UTX) in the spring, experienced the largest move higher following its inclusion with a rally of 82.3%.TER is on pace for the second-largest gain having risen 39.04% since joining back in September. On the other hand, Paycom (PAYC) fell 24.27% after joining the S&P; the worst of any of these stocks.
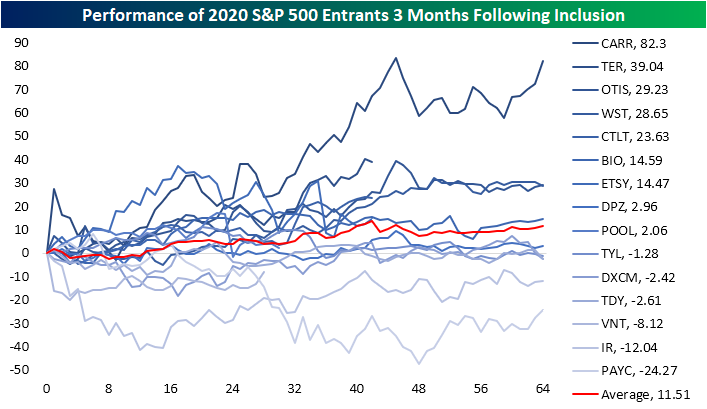
Paycom’s decline in the three months following its inclusion was largely a function of very poor timing though. The stock was added to the index in late January, meaning that 3 month period essentially covered the whole of the COVID Crash in February and March. Since its inclusion, though, it has rallied 21.2%. That is roughly 1.5 percentage points lower than the median performance to date of all 2020 additions since being added to the index. Dexcom (DXCM) and the newest addition Vontier (VNT) are the only stocks to currently sit below their levels from prior to addition.
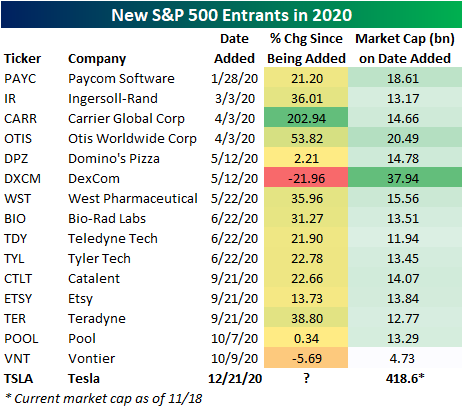
As for what this means for Tesla (TSLA) in the months to come, recent history has shown new additions to the index have been treated well by investors, but TSLA has one major distinguishing feature: its size. As shown below, TSLA’s current market cap is $418.6 billion. By comparison of other additions in 2020, on the respective date, it was added to the index, DexCom (DXCM) was the largest with a $37.94 billion market cap. That is 11 times smaller than TSLA today. By that same rate, the largest stock in terms of current market cap is Carrier (CARR) at $34.98 billion. With respect to CARR, TSLA is 12 times its size even after CARR’s stock price has tripled since being included in the S&P!
Disclaimer: For more global markets and macroeconomic coverage, make sure to check out Bespoke’s Morning Lineup and nightly Closer notes, as well as our ...
more

