
Some Strange Things About Inflation Expectations

I was interviewed for a Markeplace piece on some of the strange beliefs people have about how the government measures inflation.
One of the tangential points I mentioned to the reporter (it didn’t make into the article) is household inflation expectations are consistently upwardly biased (by about a percentage point). This is shown in the below graph with ex post inflation (black) against forecasted from Survey of Professional Forecasters (blue) and Michigan (red).
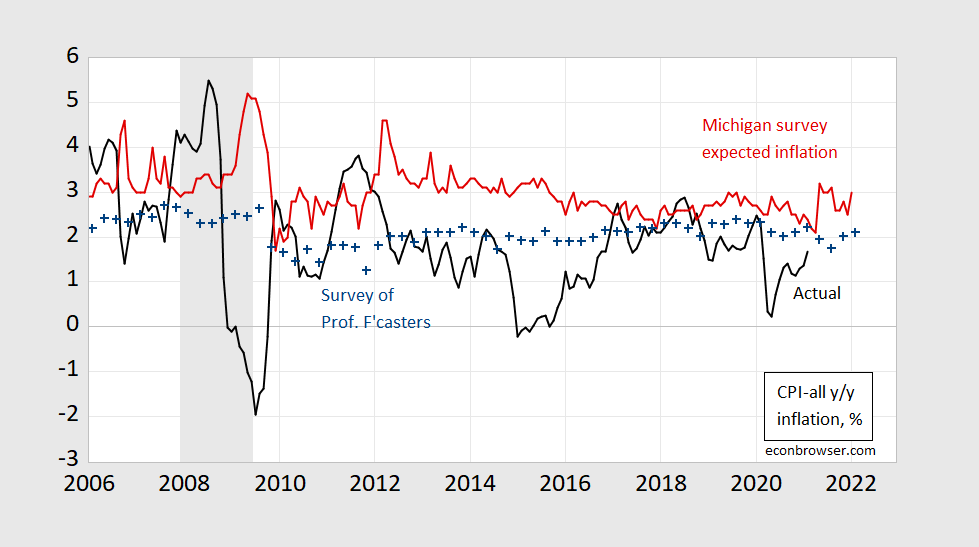
Figure 1: CPI inflation year-on-year (black), median expected from Survey of Professional Forecasters (blue), median expected from Michigan Survey of Consumers (red). NBER defined recession dates shaded gray. Source: BLS, University of Michigan via FRED, Philadelphia Fed, NBER, and author’s calculations.
Coibion and Gorodnichenko (2015) discuss some of the implications of the bias in the household survey expectations; see also this post.
If households had continuously updated their estimate of the CPI level based on their expectations from January 2008 onward, the implied level would be the shown as the red squares in the below graph.
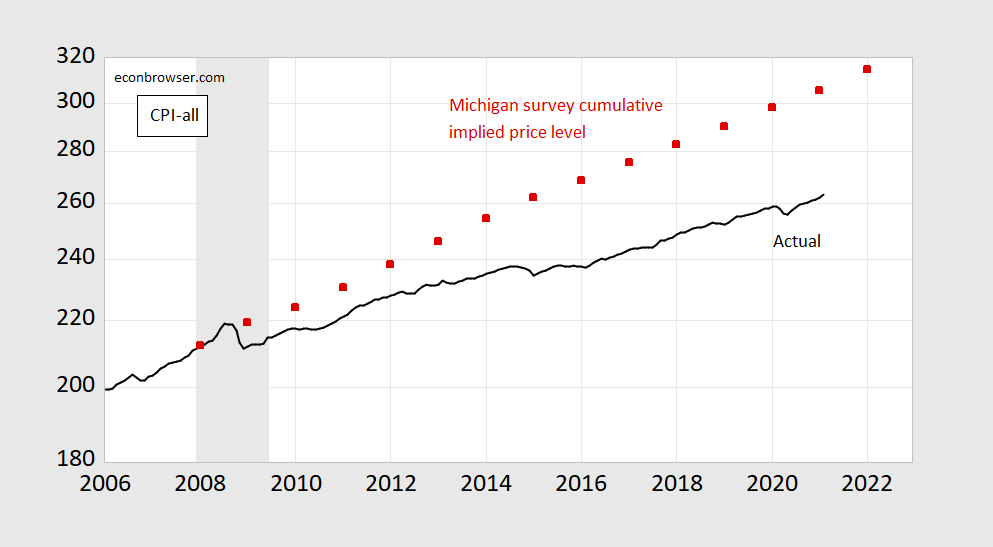
Figure 2: CPI level (black), implied level using median expected from Michigan Survey of Consumers from January 2008 onward (red). NBER defined recession dates shaded gray. Source: BLS, University of Michigan via FRED, NBER, and author’s calculations.
Other interesting things about consumer prices: (1) the CPI is plutocratic. (2) you can’t know the “true” rate of inflation without knowing the underlying representative agent utility function.
Also, people should read about index number theory.
Disclosure: None.


