
Soft Commodities Speculators Raise Cocoa Bullish Bets To 5-Week High
Image Source: Unsplash
Here are the latest charts and statistics for the Commitment of Traders (COT) data published by the Commodities Futures Trading Commission (CFTC). The latest COT data is updated through Tuesday, March 29, and shows a quick view of how large traders (for-profit speculators and commercial entities) were positioned in the futures markets.
Highlighting the COT soft commodities data is the recent rises in cocoa futures bets. The speculative net position in the cocoa futures rose this week by the largest one-week amount in the past seven weeks and rose for the third time in the past four weeks. This week’s boost brought the current net standing to the highest standing in the past five weeks at just under the +40,000 net position level.
The cocoa speculator position has been mostly in bullish territory over the past three years with small, short-lived pockets in bearish territory along the way. Cocoa saw its highest sentiment levels of the past three years in early 2020 with speculator positions reaching over +80,000 contracts before positions dropped sharply as the pandemic began.
Speculator bets fell as low as -17,038 contracts in July 2020. Since then, cocoa bets have fluctuated between small bearish levels all the way up to +40,000 contracts. Meanwhile, the cocoa price has similarly fluctuated, but it has maintained a bullish uptrend. This week’s +39,674 contracts level marks a 56.5% strength index score, which equates to a slightly bullish level compared to the past three years.
All of the soft commodities that saw higher bets this week were sugar (5,785 contracts), live cattle (6,006 contracts), lean hogs (7,209 contracts), cocoa (8,470 contracts), and wheat (4,069 contracts).
The soft commodity markets that saw lower speculator bets this week were corn (-37,264 contracts), coffee (-3,162 contracts), soybeans (-12,167 contracts), soybean oil (-5,284 contracts), soybean meal (-6,999 contracts), and cotton (-3,194 contracts).
Data Snapshot of Commodity Market Traders | Columns Legend
| WTI Crude | 1,795,929 | 1 | 318,731 | 0 | -360,162 | 99 | 41,431 | 73 |
| Corn | 1,515,106 | 24 | 482,092 | 92 | -424,699 | 11 | -57,393 | 10 |
| Natural Gas | 1,100,690 | 4 | -137,411 | 37 | 92,762 | 60 | 44,649 | 92 |
| Sugar | 819,459 | 1 | 161,581 | 70 | -202,758 | 30 | 41,177 | 59 |
| Soybeans | 755,139 | 34 | 206,469 | 81 | -178,764 | 24 | -27,705 | 24 |
| Gold | 574,521 | 39 | 257,596 | 70 | -285,937 | 30 | 28,341 | 45 |
| Heating Oil | 349,618 | 31 | 6,455 | 52 | -32,434 | 37 | 25,979 | 88 |
| Wheat | 341,224 | 3 | 13,559 | 59 | -9,435 | 32 | -4,124 | 91 |
| Coffee | 227,547 | 6 | 38,689 | 77 | -42,092 | 27 | 3,403 | 12 |
| Copper | 203,692 | 29 | 30,581 | 64 | -37,333 | 34 | 6,752 | 64 |
| Brent | 188,542 | 30 | -25,220 | 69 | 21,609 | 29 | 3,611 | 58 |
| Silver | 147,370 | 14 | 48,240 | 70 | -61,372 | 39 | 13,132 | 19 |
| Platinum | 61,807 | 25 | 14,001 | 22 | -20,754 | 79 | 6,753 | 56 |
| Palladium | 6,720 | 1 | -2,011 | 10 | 1,364 | 84 | 647 | 81 |
Corn Futures:
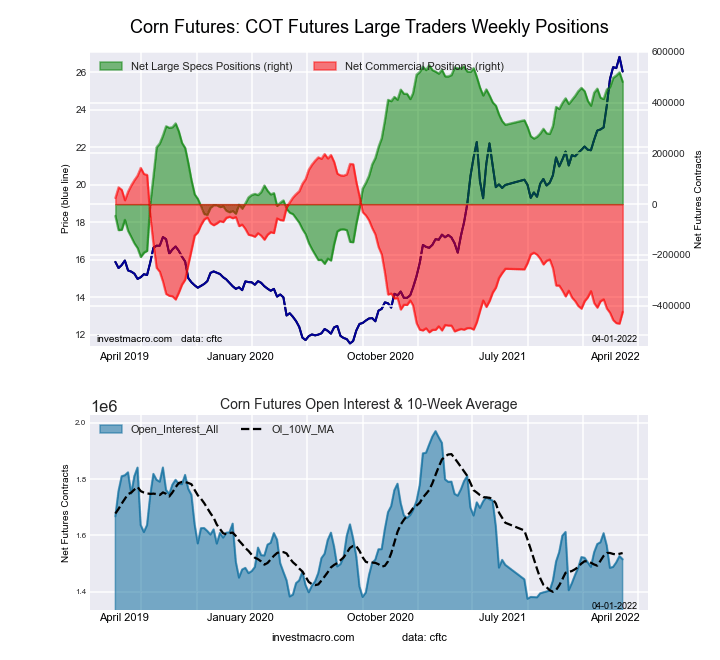
The corn large speculator standing this week reached a net position of 482,092 contracts in the data reported through Tuesday. This was a weekly fall of -37,264 contracts from the previous week, which had a total of 519,356 net contracts.
This week’s current strength score (the trader positioning range over the past three years, measured from 0 to 100) shows the speculators are currently Bullish-Extreme with a score of 91.6%. The commercials are Bearish-Extreme with a score of 11.4%, and the small traders (not shown in chart) are Bearish-Extreme with a score of 10.0%.
| CORN Futures Statistics | SPECULATORS | COMMERCIALS | SMALL TRADERS |
| –% of Open Interest Longs: | 36.5 | 45.6 | 8.8 |
| –% of Open Interest Shorts: | 4.6 | 73.7 | 12.6 |
| – Net Position: | 482,092 | -424,699 | -57,393 |
| – Gross Longs: | 552,536 | 691,549 | 133,661 |
| – Gross Shorts: | 70,444 | 1,116,248 | 191,054 |
| – Long to Short Ratio: | 7.8 to 1 | 0.6 to 1 | 0.7 to 1 |
| NET POSITION TREND: | |||
| – Strength Index Score (3 Year Range Pct): | 91.6 | 11.4 | 10.0 |
| – Strength Index Reading (3 Year Range): | Bullish-Extreme | Bearish-Extreme | Bearish-Extreme |
| NET POSITION MOVEMENT INDEX: | |||
| – 6-Week Change in Strength Index: | 8.6 | -7.1 | -10.3 |
Sugar Futures:
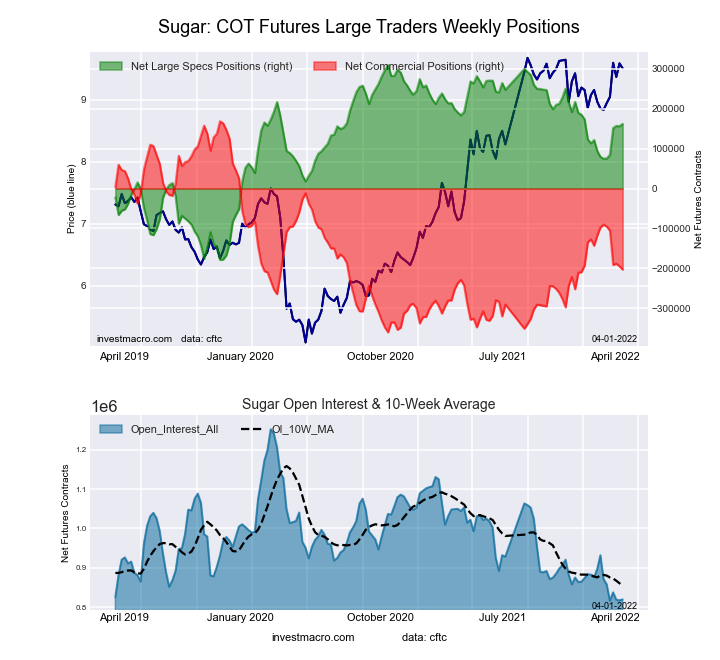
The sugar large speculator standing this week reached a net position of 161,581 contracts in the data reported through Tuesday. This was a weekly rise of 5,785 contracts from the previous week, which had a total of 155,796 net contracts.
This week’s current strength score (the trader positioning range over the past three years, measured from 0 to 100) shows the speculators are currently Bullish with a score of 69.8%. The commercials are Bearish with a score of 29.7%, and the small traders (not shown in chart) are Bullish with a score of 58.8%.
| SUGAR Futures Statistics | SPECULATORS | COMMERCIALS | SMALL TRADERS |
| –% of Open Interest Longs: | 27.1 | 49.9 | 11.1 |
| –% of Open Interest Shorts: | 7.4 | 74.6 | 6.0 |
| – Net Position: | 161,581 | -202,758 | 41,177 |
| – Gross Longs: | 222,154 | 408,820 | 90,668 |
| – Gross Shorts: | 60,573 | 611,578 | 49,491 |
| – Long to Short Ratio: | 3.7 to 1 | 0.7 to 1 | 1.8 to 1 |
| NET POSITION TREND: | |||
| – Strength Index Score (3 Year Range Pct): | 69.8 | 29.7 | 58.8 |
| – Strength Index Reading (3 Year Range): | Bullish | Bearish | Bullish |
| NET POSITION MOVEMENT INDEX: | |||
| – 6-Week Change in Strength Index: | 17.9 | -21.3 | 31.3 |
Coffee Futures:
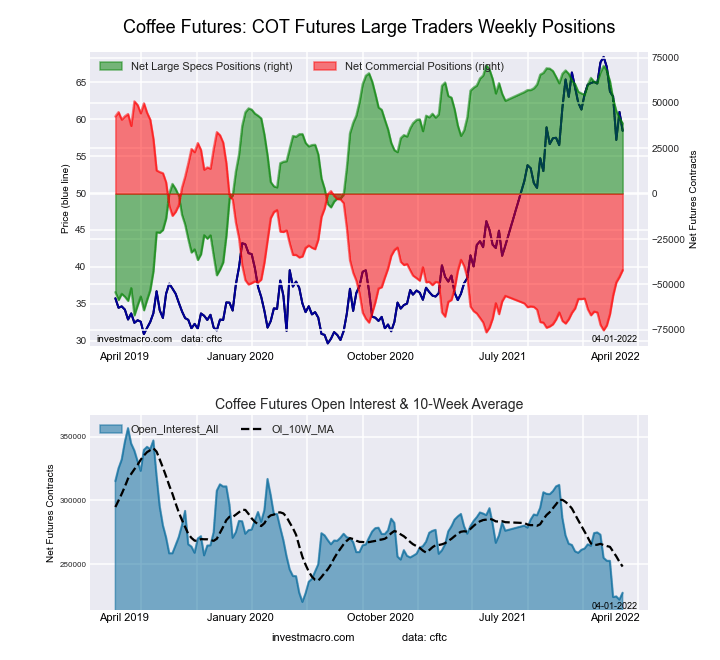
The coffee large speculator standing this week reached a net position of 38,689 contracts in the data reported through Tuesday. This was a weekly reduction of -3,162 contracts from the previous week, which had a total of 41,851 net contracts.
This week’s current strength score (the trader positioning range over the past three years, measured from 0 to 100) shows the speculators are currently Bullish with a score of 76.7%. The commercials are Bearish with a score of 26.9%, and the small traders (not shown in chart) are Bearish-Extreme with a score of 11.9%.
| COFFEE Futures Statistics | SPECULATORS | COMMERCIALS | SMALL TRADERS |
| –% of Open Interest Longs: | 22.4 | 53.3 | 4.3 |
| –% of Open Interest Shorts: | 5.4 | 71.8 | 2.8 |
| – Net Position: | 38,689 | -42,092 | 3,403 |
| – Gross Longs: | 50,991 | 121,208 | 9,798 |
| – Gross Shorts: | 12,302 | 163,300 | 6,395 |
| – Long to Short Ratio: | 4.1 to 1 | 0.7 to 1 | 1.5 to 1 |
| NET POSITION TREND: | |||
| – Strength Index Score (3 Year Range Pct): | 76.7 | 26.9 | 11.9 |
| – Strength Index Reading (3 Year Range): | Bullish | Bearish | Bearish-Extreme |
| NET POSITION MOVEMENT INDEX: | |||
| – 6-Week Change in Strength Index: | -23.0 | 26.1 | -9.7 |
Soybeans Futures:
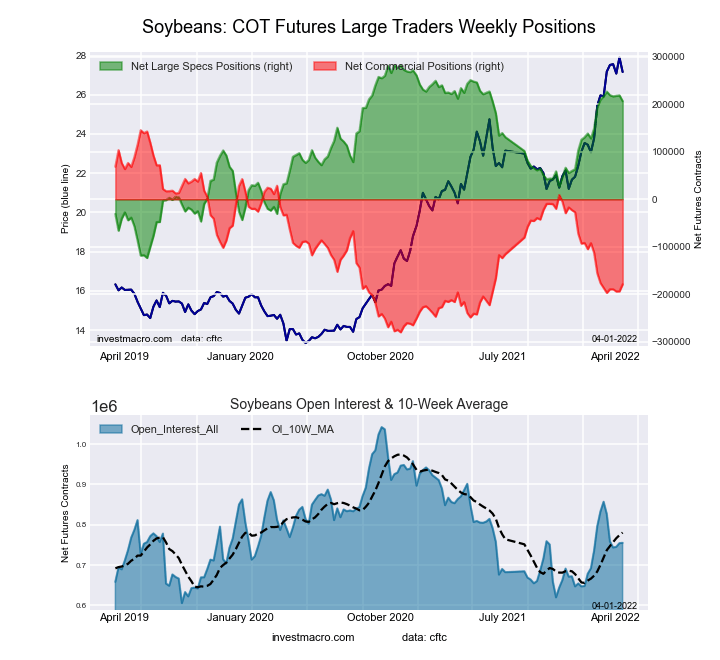
The soybeans large speculator standing this week reached a net position of 206,469 contracts in the data reported through Tuesday. This was a weekly fall of -12,167 contracts from the previous week, which had a total of 218,636 net contracts.
This week’s current strength score (the trader positioning range over the past three years, measured from 0 to 100) shows the speculators are currently Bullish-Extreme with a score of 81.4%. The commercials are Bearish with a score of 23.8%, and the small traders (not shown in chart) are Bearish with a score of 24.2%.
| SOYBEANS Futures Statistics | SPECULATORS | COMMERCIALS | SMALL TRADERS |
| –% of Open Interest Longs: | 33.6 | 46.4 | 6.9 |
| –% of Open Interest Shorts: | 6.3 | 70.1 | 10.6 |
| – Net Position: | 206,469 | -178,764 | -27,705 |
| – Gross Longs: | 253,726 | 350,240 | 52,406 |
| – Gross Shorts: | 47,257 | 529,004 | 80,111 |
| – Long to Short Ratio: | 5.4 to 1 | 0.7 to 1 | 0.7 to 1 |
| NET POSITION TREND: | |||
| – Strength Index Score (3 Year Range Pct): | 81.4 | 23.8 | 24.2 |
| – Strength Index Reading (3 Year Range): | Bullish-Extreme | Bearish | Bearish |
| NET POSITION MOVEMENT INDEX: | |||
| – 6-Week Change in Strength Index: | -2.5 | 1.8 | 4.4 |
Soybean Oil Futures:

The soybean oil large speculator standing this week reached a net position of 87,284 contracts in the data reported through Tuesday. This was a weekly decrease of -5,284 contracts from the previous week, which had a total of 92,568 net contracts.
This week’s current strength score (the trader positioning range over the past three years, measured from 0 to 100) shows the speculators are currently Bullish with a score of 70.9%. The commercials are Bearish with a score of 28.4%, and the small traders (not shown in chart) are Bullish with a score of 71.5%.
| SOYBEAN OIL Futures Statistics | SPECULATORS | COMMERCIALS | SMALL TRADERS |
| –% of Open Interest Longs: | 30.6 | 49.1 | 9.8 |
| –% of Open Interest Shorts: | 5.0 | 79.3 | 5.2 |
| – Net Position: | 87,284 | -102,850 | 15,566 |
| – Gross Longs: | 104,186 | 167,198 | 33,429 |
| – Gross Shorts: | 16,902 | 270,048 | 17,863 |
| – Long to Short Ratio: | 6.2 to 1 | 0.6 to 1 | 1.9 to 1 |
| NET POSITION TREND: | |||
| – Strength Index Score (3 Year Range Pct): | 70.9 | 28.4 | 71.5 |
| – Strength Index Reading (3 Year Range): | Bullish | Bearish | Bullish |
| NET POSITION MOVEMENT INDEX: | |||
| – 6-Week Change in Strength Index: | 10.8 | -11.1 | 8.3 |
Soybean Meal Futures:
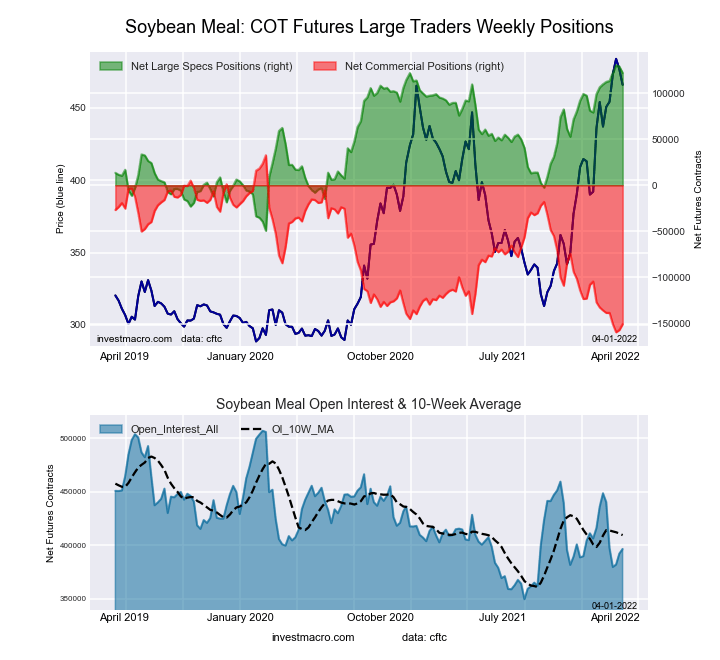
The soybean meal large speculator standing this week reached a net position of 121,785 contracts in the data reported through Tuesday. This was a weekly fall of -6,999 contracts from the previous week, which had a total of 128,784 net contracts.
This week’s current strength score (the trader positioning range over the past three years, measured from 0 to 100) shows the speculators are currently Bullish-Extreme with a score of 95.3%. The commercials are Bearish-Extreme with a score of 4.6%, and the small traders (not shown in chart) are Bullish-Extreme with a score of 85.9%.
| SOYBEAN MEAL Futures Statistics | SPECULATORS | COMMERCIALS | SMALL TRADERS |
| –% of Open Interest Longs: | 34.3 | 41.8 | 12.1 |
| –% of Open Interest Shorts: | 3.6 | 79.8 | 4.8 |
| – Net Position: | 121,785 | -150,719 | 28,934 |
| – Gross Longs: | 135,876 | 165,743 | 47,934 |
| – Gross Shorts: | 14,091 | 316,462 | 19,000 |
| – Long to Short Ratio: | 9.6 to 1 | 0.5 to 1 | 2.5 to 1 |
| NET POSITION TREND: | |||
| – Strength Index Score (3 Year Range Pct): | 95.3 | 4.6 | 85.9 |
| – Strength Index Reading (3 Year Range): | Bullish-Extreme | Bearish-Extreme | Bullish-Extreme |
| NET POSITION MOVEMENT INDEX: | |||
| – 6-Week Change in Strength Index: | 6.8 | -7.8 | 11.4 |
Live Cattle Futures:
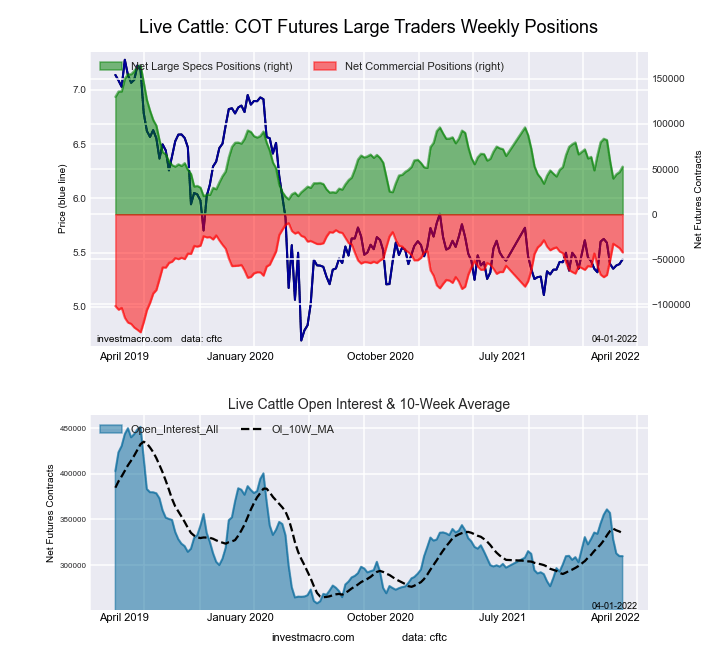
The live cattle large speculator standing this week reached a net position of 52,745 contracts in the data reported through Tuesday. This was a weekly advance of 6,006 contracts from the previous week, which had a total of 46,739 net contracts.
This week’s current strength score (the trader positioning range over the past three years, measured from 0 to 100) shows the speculators are currently Bearish with a score of 24.4%. The commercials are Bullish with a score of 73.1%, and the small traders (not shown in chart) are Bullish with a score of 61.8%.
| LIVE CATTLE Futures Statistics | SPECULATORS | COMMERCIALS | SMALL TRADERS |
| –% of Open Interest Longs: | 35.4 | 41.7 | 10.5 |
| –% of Open Interest Shorts: | 18.3 | 55.4 | 13.8 |
| – Net Position: | 52,745 | -42,343 | -10,402 |
| – Gross Longs: | 109,521 | 129,222 | 32,487 |
| – Gross Shorts: | 56,776 | 171,565 | 42,889 |
| – Long to Short Ratio: | 1.9 to 1 | 0.8 to 1 | 0.8 to 1 |
| NET POSITION TREND: | |||
| – Strength Index Score (3 Year Range Pct): | 24.4 | 73.1 | 61.8 |
| – Strength Index Reading (3 Year Range): | Bearish | Bullish | Bullish |
| NET POSITION MOVEMENT INDEX: | |||
| – 6-Week Change in Strength Index: | -20.7 | 22.6 | 8.5 |
Lean Hogs Futures:
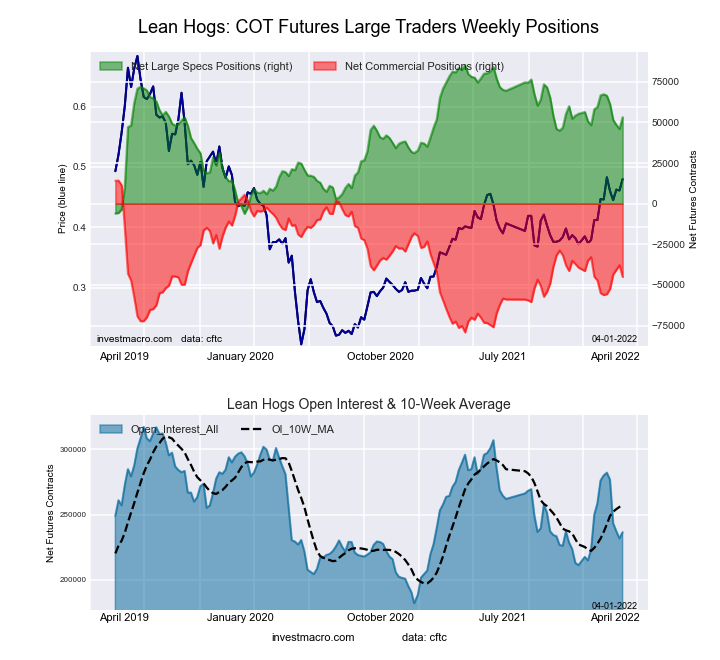
The lean hogs large speculator standing this week reached a net position of 53,194 contracts in the data reported through Tuesday. This was a weekly increase of 7,209 contracts from the previous week, which had a total of 45,985 net contracts.
This week’s current strength score (the trader positioning range over the past three years, measured from 0 to 100) shows the speculators are currently Bullish with a score of 64.7%. The commercials are Bearish with a score of 40.3%, and the small traders (not shown in chart) are Bullish with a score of 52.4%.
| LEAN HOGS Futures Statistics | SPECULATORS | COMMERCIALS | SMALL TRADERS |
| –% of Open Interest Longs: | 39.1 | 33.7 | 9.7 |
| –% of Open Interest Shorts: | 16.6 | 52.7 | 13.1 |
| – Net Position: | 53,194 | -45,016 | -8,178 |
| – Gross Longs: | 92,407 | 79,772 | 22,919 |
| – Gross Shorts: | 39,213 | 124,788 | 31,097 |
| – Long to Short Ratio: | 2.4 to 1 | 0.6 to 1 | 0.7 to 1 |
| NET POSITION TREND: | |||
| – Strength Index Score (3 Year Range Pct): | 64.7 | 40.3 | 52.4 |
| – Strength Index Reading (3 Year Range): | Bullish | Bearish | Bullish |
| NET POSITION MOVEMENT INDEX: | |||
| – 6-Week Change in Strength Index: | -15.4 | 13.2 | 15.0 |
Cotton Futures:
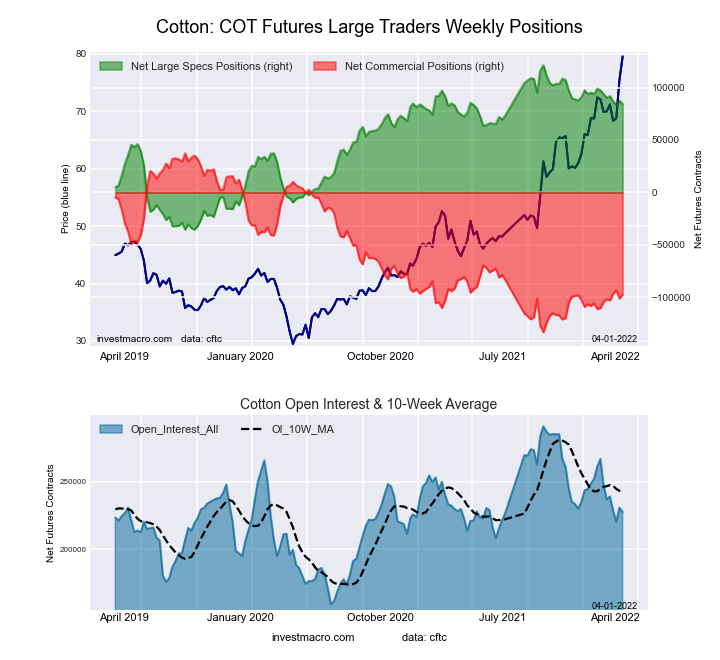
The cotton large speculator standing this week reached a net position of 84,160 contracts in the data reported through Tuesday. This was a weekly decrease of -3,194 contracts from the previous week, which had a total of 87,354 net contracts.
This week’s current strength score (the trader positioning range over the past three years, measured from 0 to 100) shows the speculators are currently Bullish with a score of 76.3%. The commercials are Bearish with a score of 21.1%, and the small traders (not shown in chart) are Bullish-Extreme with a score of 95.3%.
| COTTON Futures Statistics | SPECULATORS | COMMERCIALS | SMALL TRADERS |
| –% of Open Interest Longs: | 43.2 | 36.1 | 9.0 |
| –% of Open Interest Shorts: | 6.2 | 78.8 | 3.2 |
| – Net Position: | 84,160 | -97,258 | 13,098 |
| – Gross Longs: | 98,239 | 82,066 | 20,362 |
| – Gross Shorts: | 14,079 | 179,324 | 7,264 |
| – Long to Short Ratio: | 7.0 to 1 | 0.5 to 1 | 2.8 to 1 |
| NET POSITION TREND: | |||
| – Strength Index Score (3 Year Range Pct): | 76.3 | 21.1 | 95.3 |
| – Strength Index Reading (3 Year Range): | Bullish | Bearish | Bullish-Extreme |
| NET POSITION MOVEMENT INDEX: | |||
| – 6-Week Change in Strength Index: | -6.1 | 4.1 | 15.8 |
Cocoa Futures:
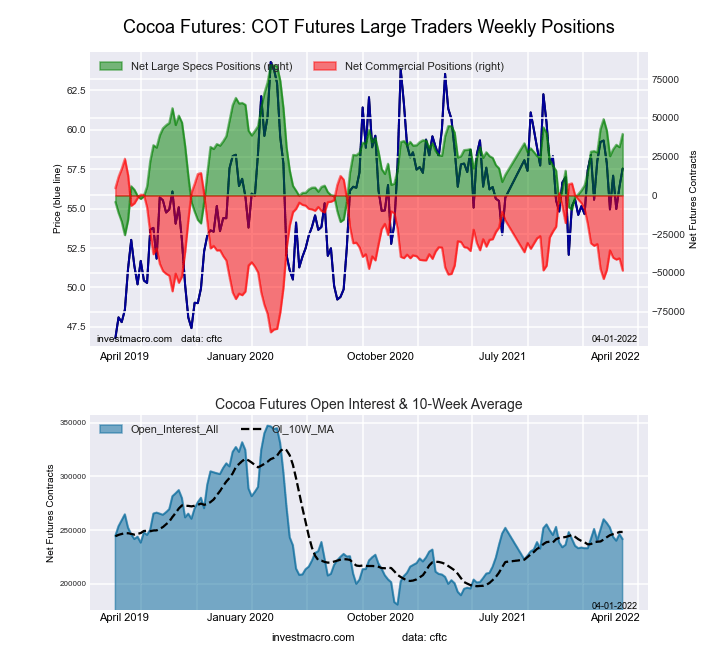
The cocoa large speculator standing this week reached a net position of 39,674 contracts in the data reported through Tuesday. This was a weekly rise of 8,470 contracts from the previous week, which had a total of 31,204 net contracts.
This week’s current strength score (the trader positioning range over the past three years, measured from 0 to 100) shows the speculators are currently Bullish with a score of 56.5%. The commercials are Bearish with a score of 38.8%, and the small traders (not shown in chart) are Bullish-Extreme with a score of 84.9%.
| COCOA Futures Statistics | SPECULATORS | COMMERCIALS | SMALL TRADERS |
| –% of Open Interest Longs: | 30.7 | 47.4 | 7.3 |
| –% of Open Interest Shorts: | 14.3 | 67.5 | 3.7 |
| – Net Position: | 39,674 | -48,448 | 8,774 |
| – Gross Longs: | 74,233 | 114,490 | 17,726 |
| – Gross Shorts: | 34,559 | 162,938 | 8,952 |
| – Long to Short Ratio: | 2.1 to 1 | 0.7 to 1 | 2.0 to 1 |
| NET POSITION TREND: | |||
| – Strength Index Score (3 Year Range Pct): | 56.5 | 38.8 | 84.9 |
| – Strength Index Reading (3 Year Range): | Bullish | Bearish | Bullish-Extreme |
| NET POSITION MOVEMENT INDEX: | |||
| – 6-Week Change in Strength Index: | -9.3 | 5.2 | 40.5 |
Wheat Futures:
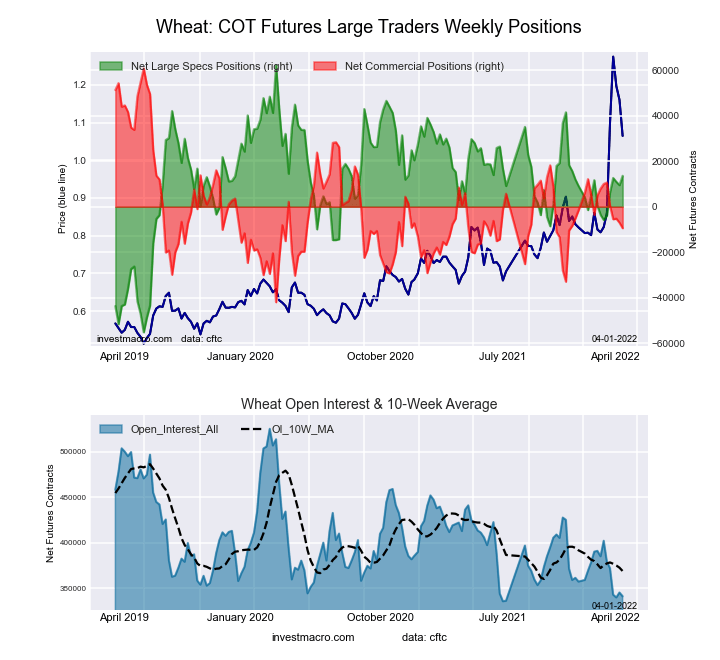
The wheat large speculator standing this week reached a net position of 13,559 contracts in the data reported through Tuesday. This was a weekly rise of 4,069 contracts from the previous week, which had a total of 9,490 net contracts.
This week’s current strength score (the trader positioning range over the past three years, measured from 0 to 100) shows the speculators are currently Bullish with a score of 58.6%. The commercials are Bearish with a score of 31.7%, and the small traders (not shown in chart) are Bullish-Extreme with a score of 91.2%.
| WHEAT Futures Statistics | SPECULATORS | COMMERCIALS | SMALL TRADERS |
| –% of Open Interest Longs: | 33.1 | 40.5 | 9.1 |
| –% of Open Interest Shorts: | 29.1 | 43.3 | 10.3 |
| – Net Position: | 13,559 | -9,435 | -4,124 |
| – Gross Longs: | 112,940 | 138,288 | 31,061 |
| – Gross Shorts: | 99,381 | 147,723 | 35,185 |
| – Long to Short Ratio: | 1.1 to 1 | 0.9 to 1 | 0.9 to 1 |
| NET POSITION TREND: | |||
| – Strength Index Score (3 Year Range Pct): | 58.6 | 31.7 | 91.2 |
| – Strength Index Reading (3 Year Range): | Bullish | Bearish | Bullish-Extreme |
| NET POSITION MOVEMENT INDEX: | |||
| – 6-Week Change in Strength Index: | 16.5 | -18.9 | 0.2 |
Article By InvestMacro – Receive our weekly COT Reports by Email
*COT Report: The COT data, released weekly to the public each Friday, is updated through the most recent Tuesday (data is three days old) and shows a quick view of how large speculators or non-commercials (for-profit traders) were positioned in the futures markets.
The CFTC categorizes trader positions according to commercial hedgers (traders who use futures contracts for hedging as part of the business), non-commercials (large traders who speculate to realize trading profits), and nonreportable traders (usually small traders/speculators) as well as their open interest (contracts open in the market at time of reporting). See CFTC criteria here.
Disclosure: Foreign Currency trading and trading on margin carries a high level of risk and can result in loss of part or all of your investment.Due to the level of risk and market volatility, ...
more

