
Soft Commodities Speculators Continue To Boost Their Sugar Bullish Bets To 20-Week High
Here are the latest charts and statistics for the Commitment of Traders (COT) data published by the Commodities Futures Trading Commission (CFTC).
The latest COT data is updated through Tuesday April 12th and shows a quick view of how large traders (for-profit speculators and commercial entities) were positioned in the futures markets.
Highlighting the COT soft commodities data is once again a surge higher in this week’s Sugar futures bets. The speculative net position in the Sugar futures gained for a third consecutive week this week and for the seventh time in the past eight weeks. Sugar bullish bets have increased by a total of +165,301 contracts over that eight-week time-frame, going from 74,563 net contracts on February 15th to a total of 239,864 net contracts through Tuesday. This sentiment boost has now brought the current speculator net position to the most bullish level of the past twenty weeks, dating back to November 30th. Sugar prices have been strong as well and traded this week at their highest standing since back in November.
The soft commodities that saw higher bets this week were Corn (8,508 contracts), Sugar (51,317 contracts), Coffee (4,118 contracts), Soybean Oil (8,828 contracts), Live Cattle (2,775 contracts), Cocoa (2,525 contracts) and Wheat (3,935 contracts).
The markets with declining speculator bets this week were Soybeans (-629 contracts), Lean Hogs (-4,729 contracts), Cotton (-1,090 contracts) and Soybean Meal (-7,520 contracts).
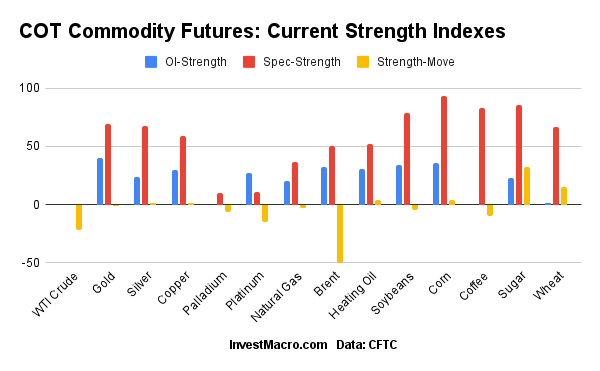
Speculator strength standings for each Commodity where strength index is current net position compared to past three years, above 80 is bullish extreme, below 20 is bearish extreme
OI Strength = Current Open Interest level compared to last 3 years range
Spec Strength = Current Net Speculator level compared to last 3 years range
Strength Move = Six week change of Spec Strength
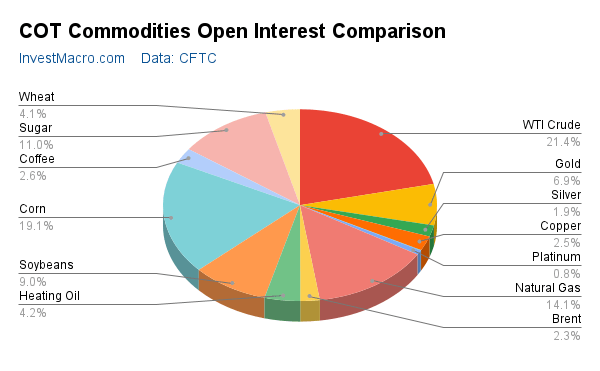
Data Snapshot of Commodity Market Traders | Columns Legend
| WTI Crude | 1,783,725 | 0 | 304,778 | 0 | -350,603 | 100 | 45,825 | 80 |
| Corn | 1,589,848 | 36 | 495,581 | 93 | -443,706 | 9 | -51,875 | 13 |
| Natural Gas | 1,170,828 | 20 | -137,549 | 37 | 90,221 | 59 | 47,328 | 99 |
| Sugar | 916,130 | 23 | 239,864 | 86 | -301,628 | 11 | 61,764 | 84 |
| Soybeans | 752,157 | 34 | 198,295 | 79 | -170,694 | 26 | -27,601 | 24 |
| Gold | 577,639 | 40 | 254,287 | 69 | -288,093 | 30 | 33,806 | 60 |
| Heating Oil | 349,618 | 31 | 6,455 | 52 | -32,434 | 37 | 25,979 | 88 |
| Wheat | 338,271 | 1 | 23,886 | 67 | -21,258 | 20 | -2,628 | 99 |
| Coffee | 214,938 | 0 | 47,929 | 83 | -52,716 | 19 | 4,787 | 24 |
| Copper | 204,825 | 30 | 23,350 | 59 | -29,249 | 39 | 5,899 | 59 |
| Brent | 190,488 | 32 | -36,318 | 50 | 33,933 | 50 | 2,385 | 41 |
| Silver | 158,813 | 24 | 45,986 | 68 | -63,690 | 36 | 17,704 | 46 |
| Platinum | 63,363 | 27 | 6,415 | 11 | -13,233 | 90 | 6,818 | 57 |
| Palladium | 6,340 | 0 | -2,033 | 10 | 1,402 | 84 | 631 | 80 |
CORN Futures:
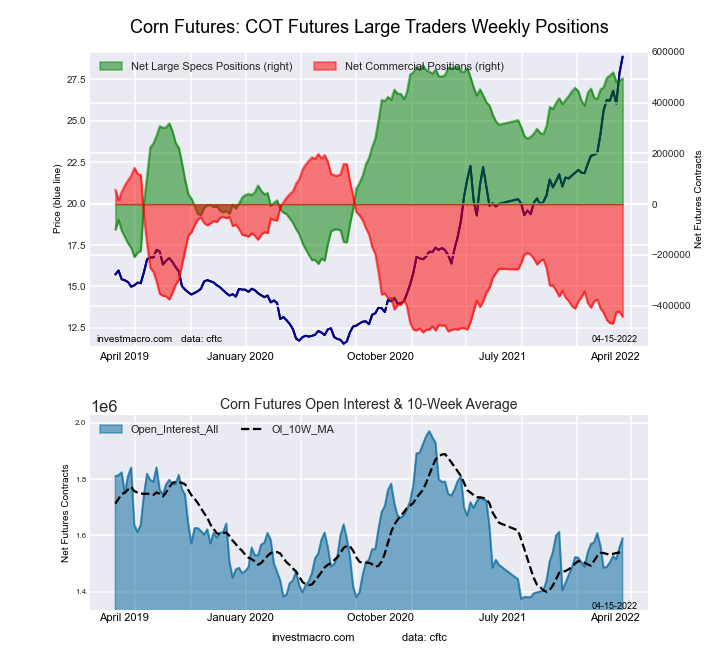
The CORN large speculator standing this week came in at a net position of 495,581 contracts in the data reported through Tuesday. This was a weekly lift of 8,508 contracts from the previous week which had a total of 487,073 net contracts.
This week’s current strength score (the trader positioning range over the past three years, measured from 0 to 100) shows the speculators are currently Bullish-Extreme with a score of 93.3 percent. The commercials are Bearish-Extreme with a score of 8.7 percent and the small traders (not shown in chart) are Bearish-Extreme with a score of 13.2 percent.
| CORN Futures Statistics | SPECULATORS | COMMERCIALS | SMALL TRADERS |
| – Percent of Open Interest Longs: | 36.0 | 45.4 | 9.4 |
| – Percent of Open Interest Shorts: | 4.8 | 73.3 | 12.7 |
| – Net Position: | 495,581 | -443,706 | -51,875 |
| – Gross Longs: | 572,527 | 721,141 | 149,665 |
| – Gross Shorts: | 76,946 | 1,164,847 | 201,540 |
| – Long to Short Ratio: | 7.4 to 1 | 0.6 to 1 | 0.7 to 1 |
| NET POSITION TREND: | |||
| – Strength Index Score (3 Year Range Pct): | 93.3 | 8.7 | 13.2 |
| – Strength Index Reading (3 Year Range): | Bullish-Extreme | Bearish-Extreme | Bearish-Extreme |
| NET POSITION MOVEMENT INDEX: | |||
| – 6-Week Change in Strength Index: | 4.4 | -2.3 | -10.8 |
SUGAR Futures:
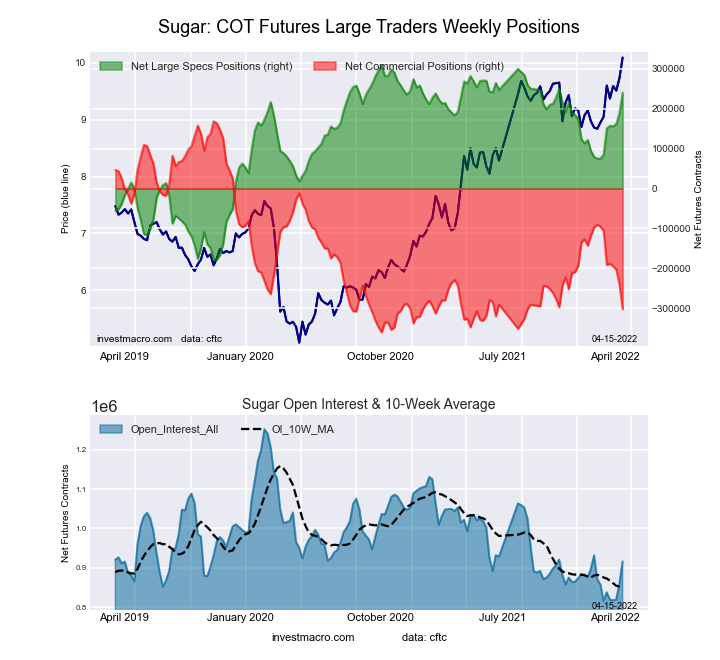
The SUGAR large speculator standing this week came in at a net position of 239,864 contracts in the data reported through Tuesday. This was a weekly rise of 51,317 contracts from the previous week which had a total of 188,547 net contracts.
This week’s current strength score (the trader positioning range over the past three years, measured from 0 to 100) shows the speculators are currently Bullish-Extreme with a score of 85.9 percent. The commercials are Bearish-Extreme with a score of 11.0 percent and the small traders (not shown in chart) are Bullish-Extreme with a score of 84.2 percent.
| SUGAR Futures Statistics | SPECULATORS | COMMERCIALS | SMALL TRADERS |
| – Percent of Open Interest Longs: | 31.9 | 44.5 | 12.1 |
| – Percent of Open Interest Shorts: | 5.8 | 77.4 | 5.4 |
| – Net Position: | 239,864 | -301,628 | 61,764 |
| – Gross Longs: | 292,621 | 407,382 | 110,845 |
| – Gross Shorts: | 52,757 | 709,010 | 49,081 |
| – Long to Short Ratio: | 5.5 to 1 | 0.6 to 1 | 2.3 to 1 |
| NET POSITION TREND: | |||
| – Strength Index Score (3 Year Range Pct): | 85.9 | 11.0 | 84.2 |
| – Strength Index Reading (3 Year Range): | Bullish-Extreme | Bearish-Extreme | Bullish-Extreme |
| NET POSITION MOVEMENT INDEX: | |||
| – 6-Week Change in Strength Index: | 31.9 | -37.2 | 50.7 |
COFFEE Futures:
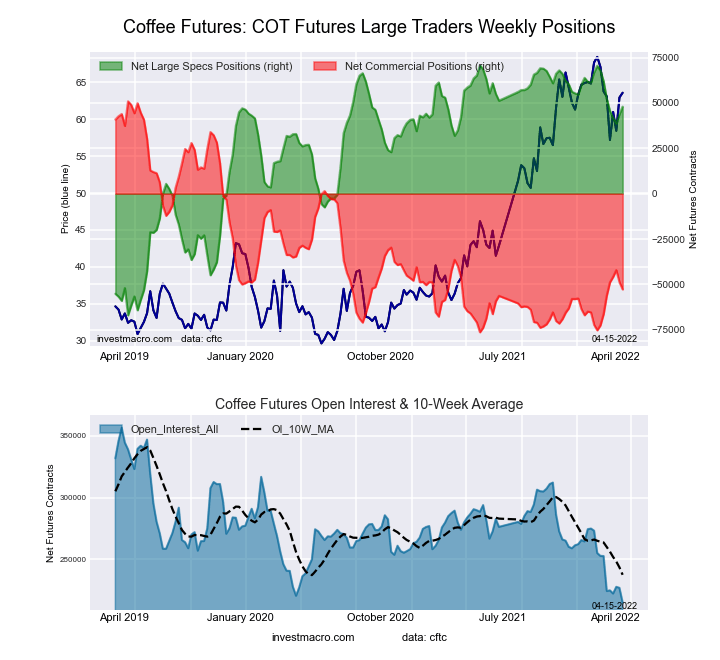
The COFFEE large speculator standing this week came in at a net position of 47,929 contracts in the data reported through Tuesday. This was a weekly increase of 4,118 contracts from the previous week which had a total of 43,811 net contracts.
This week’s current strength score (the trader positioning range over the past three years, measured from 0 to 100) shows the speculators are currently Bullish-Extreme with a score of 83.1 percent. The commercials are Bearish-Extreme with a score of 18.7 percent and the small traders (not shown in chart) are Bearish with a score of 24.4 percent.
| COFFEE Futures Statistics | SPECULATORS | COMMERCIALS | SMALL TRADERS |
| – Percent of Open Interest Longs: | 26.4 | 51.6 | 5.0 |
| – Percent of Open Interest Shorts: | 4.1 | 76.1 | 2.7 |
| – Net Position: | 47,929 | -52,716 | 4,787 |
| – Gross Longs: | 56,743 | 110,821 | 10,640 |
| – Gross Shorts: | 8,814 | 163,537 | 5,853 |
| – Long to Short Ratio: | 6.4 to 1 | 0.7 to 1 | 1.8 to 1 |
| NET POSITION TREND: | |||
| – Strength Index Score (3 Year Range Pct): | 83.1 | 18.7 | 24.4 |
| – Strength Index Reading (3 Year Range): | Bullish-Extreme | Bearish-Extreme | Bearish |
| NET POSITION MOVEMENT INDEX: | |||
| – 6-Week Change in Strength Index: | -10.4 | 10.8 | 3.2 |
SOYBEANS Futures:
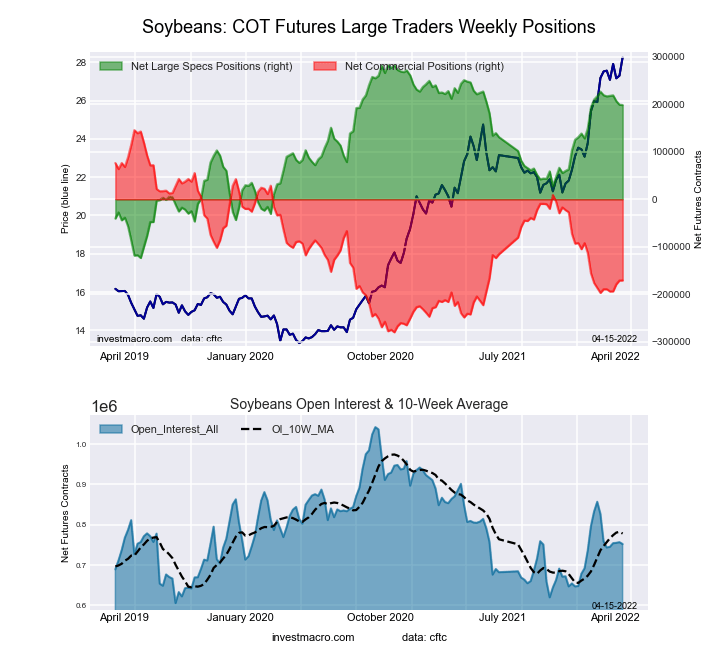
The SOYBEANS large speculator standing this week came in at a net position of 198,295 contracts in the data reported through Tuesday. This was a weekly lowering of -629 contracts from the previous week which had a total of 198,924 net contracts.
This week’s current strength score (the trader positioning range over the past three years, measured from 0 to 100) shows the speculators are currently Bullish with a score of 79.3 percent. The commercials are Bearish with a score of 25.7 percent and the small traders (not shown in chart) are Bearish with a score of 24.4 percent.
| SOYBEANS Futures Statistics | SPECULATORS | COMMERCIALS | SMALL TRADERS |
| – Percent of Open Interest Longs: | 32.9 | 47.0 | 7.1 |
| – Percent of Open Interest Shorts: | 6.6 | 69.6 | 10.8 |
| – Net Position: | 198,295 | -170,694 | -27,601 |
| – Gross Longs: | 247,765 | 353,160 | 53,388 |
| – Gross Shorts: | 49,470 | 523,854 | 80,989 |
| – Long to Short Ratio: | 5.0 to 1 | 0.7 to 1 | 0.7 to 1 |
| NET POSITION TREND: | |||
| – Strength Index Score (3 Year Range Pct): | 79.3 | 25.7 | 24.4 |
| – Strength Index Reading (3 Year Range): | Bullish | Bearish | Bearish |
| NET POSITION MOVEMENT INDEX: | |||
| – 6-Week Change in Strength Index: | -5.1 | 4.4 | 3.5 |
SOYBEAN OIL Futures:
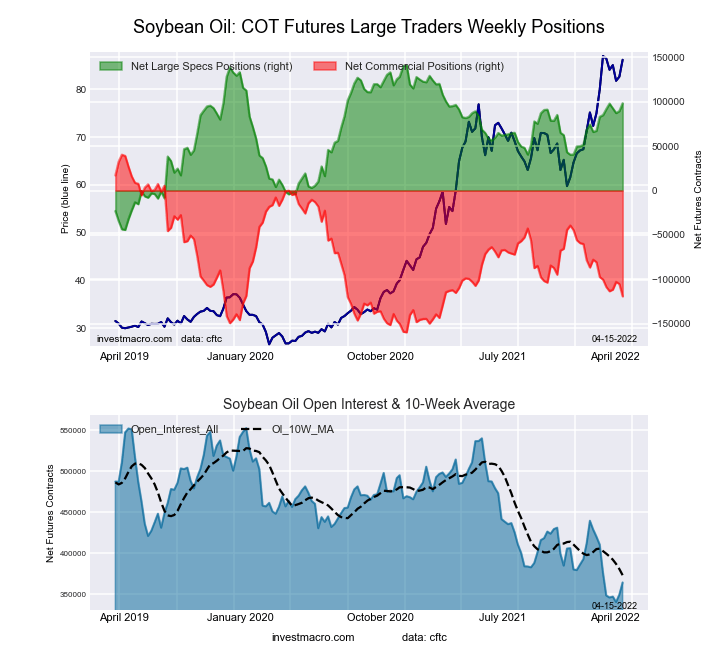
The SOYBEAN OIL large speculator standing this week came in at a net position of 98,324 contracts in the data reported through Tuesday. This was a weekly gain of 8,828 contracts from the previous week which had a total of 89,496 net contracts.
This week’s current strength score (the trader positioning range over the past three years, measured from 0 to 100) shows the speculators are currently Bullish with a score of 76.9 percent. The commercials are Bearish with a score of 20.2 percent and the small traders (not shown in chart) are Bullish-Extreme with a score of 91.1 percent.
| SOYBEAN OIL Futures Statistics | SPECULATORS | COMMERCIALS | SMALL TRADERS |
| – Percent of Open Interest Longs: | 31.2 | 46.9 | 11.1 |
| – Percent of Open Interest Shorts: | 4.2 | 79.6 | 5.4 |
| – Net Position: | 98,324 | -119,136 | 20,812 |
| – Gross Longs: | 113,809 | 170,924 | 40,463 |
| – Gross Shorts: | 15,485 | 290,060 | 19,651 |
| – Long to Short Ratio: | 7.3 to 1 | 0.6 to 1 | 2.1 to 1 |
| NET POSITION TREND: | |||
| – Strength Index Score (3 Year Range Pct): | 76.9 | 20.2 | 91.1 |
| – Strength Index Reading (3 Year Range): | Bullish | Bearish | Bullish-Extreme |
| NET POSITION MOVEMENT INDEX: | |||
| – 6-Week Change in Strength Index: | 7.2 | -9.5 | 20.6 |
SOYBEAN MEAL Futures:
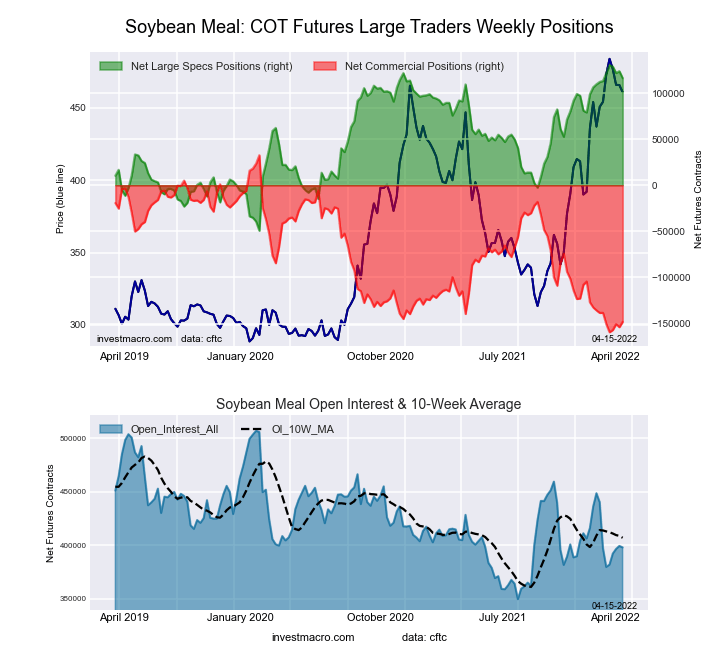
The SOYBEAN MEAL large speculator standing this week came in at a net position of 116,258 contracts in the data reported through Tuesday. This was a weekly decrease of -7,520 contracts from the previous week which had a total of 123,778 net contracts.
This week’s current strength score (the trader positioning range over the past three years, measured from 0 to 100) shows the speculators are currently Bullish-Extreme with a score of 92.2 percent. The commercials are Bearish-Extreme with a score of 5.9 percent and the small traders (not shown in chart) are Bullish-Extreme with a score of 98.7 percent.
| SOYBEAN MEAL Futures Statistics | SPECULATORS | COMMERCIALS | SMALL TRADERS |
| – Percent of Open Interest Longs: | 32.8 | 42.9 | 13.1 |
| – Percent of Open Interest Shorts: | 3.5 | 80.2 | 5.1 |
| – Net Position: | 116,258 | -148,220 | 31,962 |
| – Gross Longs: | 130,357 | 170,806 | 52,146 |
| – Gross Shorts: | 14,099 | 319,026 | 20,184 |
| – Long to Short Ratio: | 9.2 to 1 | 0.5 to 1 | 2.6 to 1 |
| NET POSITION TREND: | |||
| – Strength Index Score (3 Year Range Pct): | 92.2 | 5.9 | 98.7 |
| – Strength Index Reading (3 Year Range): | Bullish-Extreme | Bearish-Extreme | Bullish-Extreme |
| NET POSITION MOVEMENT INDEX: | |||
| – 6-Week Change in Strength Index: | 1.7 | -5.1 | 28.2 |
LIVE CATTLE Futures:
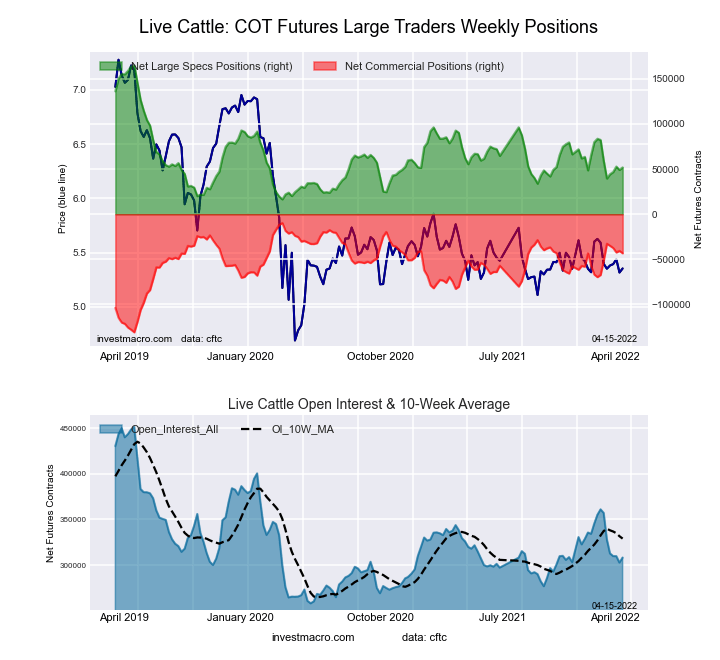
The LIVE CATTLE large speculator standing this week came in at a net position of 51,842 contracts in the data reported through Tuesday. This was a weekly advance of 2,775 contracts from the previous week which had a total of 49,067 net contracts.
This week’s current strength score (the trader positioning range over the past three years, measured from 0 to 100) shows the speculators are currently Bearish with a score of 23.8 percent. The commercials are Bullish with a score of 72.3 percent and the small traders (not shown in chart) are Bullish with a score of 65.1 percent.
| LIVE CATTLE Futures Statistics | SPECULATORS | COMMERCIALS | SMALL TRADERS |
| – Percent of Open Interest Longs: | 36.9 | 40.4 | 10.1 |
| – Percent of Open Interest Shorts: | 20.1 | 54.4 | 12.9 |
| – Net Position: | 51,842 | -43,300 | -8,542 |
| – Gross Longs: | 113,806 | 124,469 | 31,249 |
| – Gross Shorts: | 61,964 | 167,769 | 39,791 |
| – Long to Short Ratio: | 1.8 to 1 | 0.7 to 1 | 0.8 to 1 |
| NET POSITION TREND: | |||
| – Strength Index Score (3 Year Range Pct): | 23.8 | 72.3 | 65.1 |
| – Strength Index Reading (3 Year Range): | Bearish | Bullish | Bullish |
| NET POSITION MOVEMENT INDEX: | |||
| – 6-Week Change in Strength Index: | -4.8 | 6.5 | -1.6 |
LEAN HOGS Futures:
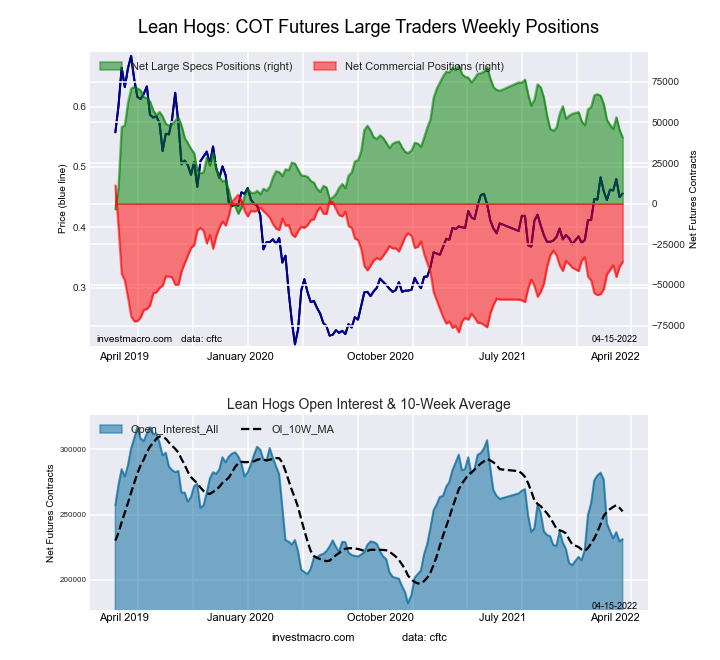
The LEAN HOGS large speculator standing this week came in at a net position of 40,771 contracts in the data reported through Tuesday. This was a weekly reduction of -4,729 contracts from the previous week which had a total of 45,500 net contracts.
This week’s current strength score (the trader positioning range over the past three years, measured from 0 to 100) shows the speculators are currently Bullish with a score of 51.2 percent. The commercials are Bullish with a score of 51.3 percent and the small traders (not shown in chart) are Bullish with a score of 68.1 percent.
| LEAN HOGS Futures Statistics | SPECULATORS | COMMERCIALS | SMALL TRADERS |
| – Percent of Open Interest Longs: | 36.4 | 35.0 | 10.2 |
| – Percent of Open Interest Shorts: | 18.7 | 50.4 | 12.4 |
| – Net Position: | 40,771 | -35,705 | -5,066 |
| – Gross Longs: | 84,112 | 80,838 | 23,679 |
| – Gross Shorts: | 43,341 | 116,543 | 28,745 |
| – Long to Short Ratio: | 1.9 to 1 | 0.7 to 1 | 0.8 to 1 |
| NET POSITION TREND: | |||
| – Strength Index Score (3 Year Range Pct): | 51.2 | 51.3 | 68.1 |
| – Strength Index Reading (3 Year Range): | Bullish | Bullish | Bullish |
| NET POSITION MOVEMENT INDEX: | |||
| – 6-Week Change in Strength Index: | -22.3 | 19.7 | 19.0 |
COTTON Futures:
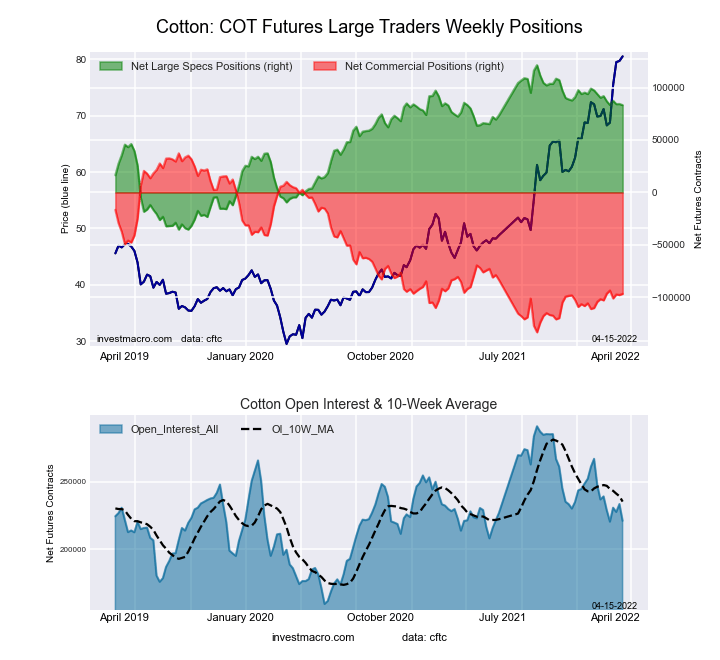
The COTTON large speculator standing this week came in at a net position of 83,220 contracts in the data reported through Tuesday. This was a weekly lowering of -1,090 contracts from the previous week which had a total of 84,310 net contracts.
This week’s current strength score (the trader positioning range over the past three years, measured from 0 to 100) shows the speculators are currently Bullish with a score of 75.7 percent. The commercials are Bearish with a score of 21.5 percent and the small traders (not shown in chart) are Bullish-Extreme with a score of 97.5 percent.
| COTTON Futures Statistics | SPECULATORS | COMMERCIALS | SMALL TRADERS |
| – Percent of Open Interest Longs: | 45.1 | 35.4 | 9.3 |
| – Percent of Open Interest Shorts: | 7.4 | 79.2 | 3.2 |
| – Net Position: | 83,220 | -96,675 | 13,455 |
| – Gross Longs: | 99,542 | 78,213 | 20,481 |
| – Gross Shorts: | 16,322 | 174,888 | 7,026 |
| – Long to Short Ratio: | 6.1 to 1 | 0.4 to 1 | 2.9 to 1 |
| NET POSITION TREND: | |||
| – Strength Index Score (3 Year Range Pct): | 75.7 | 21.5 | 97.5 |
| – Strength Index Reading (3 Year Range): | Bullish | Bearish | Bullish-Extreme |
| NET POSITION MOVEMENT INDEX: | |||
| – 6-Week Change in Strength Index: | -5.5 | 3.6 | 15.2 |
COCOA Futures:
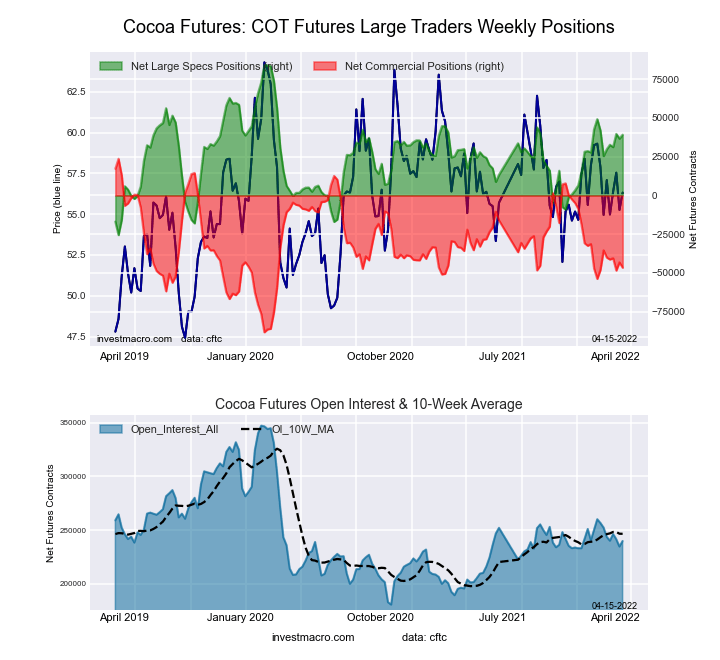
The COCOA large speculator standing this week came in at a net position of 39,159 contracts in the data reported through Tuesday. This was a weekly advance of 2,525 contracts from the previous week which had a total of 36,634 net contracts.
This week’s current strength score (the trader positioning range over the past three years, measured from 0 to 100) shows the speculators are currently Bullish with a score of 56.0 percent. The commercials are Bearish with a score of 40.6 percent and the small traders (not shown in chart) are Bullish with a score of 72.0 percent.
| COCOA Futures Statistics | SPECULATORS | COMMERCIALS | SMALL TRADERS |
| – Percent of Open Interest Longs: | 31.0 | 44.8 | 6.9 |
| – Percent of Open Interest Shorts: | 14.7 | 64.2 | 3.8 |
| – Net Position: | 39,159 | -46,610 | 7,451 |
| – Gross Longs: | 74,307 | 107,381 | 16,611 |
| – Gross Shorts: | 35,148 | 153,991 | 9,160 |
| – Long to Short Ratio: | 2.1 to 1 | 0.7 to 1 | 1.8 to 1 |
| NET POSITION TREND: | |||
| – Strength Index Score (3 Year Range Pct): | 56.0 | 40.6 | 72.0 |
| – Strength Index Reading (3 Year Range): | Bullish | Bearish | Bullish |
| NET POSITION MOVEMENT INDEX: | |||
| – 6-Week Change in Strength Index: | 13.4 | -10.9 | -24.9 |
WHEAT Futures:
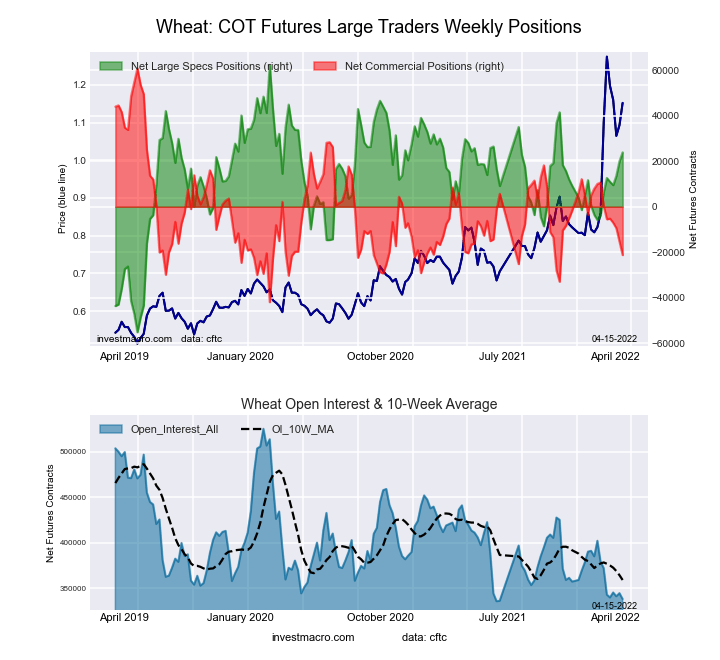
The WHEAT large speculator standing this week came in at a net position of 23,886 contracts in the data reported through Tuesday. This was a weekly lift of 3,935 contracts from the previous week which had a total of 19,951 net contracts.
This week’s current strength score (the trader positioning range over the past three years, measured from 0 to 100) shows the speculators are currently Bullish with a score of 67.4 percent. The commercials are Bearish with a score of 20.1 percent and the small traders (not shown in chart) are Bullish-Extreme with a score of 99.1 percent.
| WHEAT Futures Statistics | SPECULATORS | COMMERCIALS | SMALL TRADERS |
| – Percent of Open Interest Longs: | 35.3 | 37.1 | 9.6 |
| – Percent of Open Interest Shorts: | 28.3 | 43.4 | 10.4 |
| – Net Position: | 23,886 | -21,258 | -2,628 |
| – Gross Longs: | 119,566 | 125,657 | 32,500 |
| – Gross Shorts: | 95,680 | 146,915 | 35,128 |
| – Long to Short Ratio: | 1.2 to 1 | 0.9 to 1 | 0.9 to 1 |
| NET POSITION TREND: | |||
| – Strength Index Score (3 Year Range Pct): | 67.4 | 20.1 | 99.1 |
| – Strength Index Reading (3 Year Range): | Bullish | Bearish | Bullish-Extreme |
| NET POSITION MOVEMENT INDEX: | |||
| – 6-Week Change in Strength Index: | 14.9 | -21.0 | 21.9 |
*COT Report: The COT data, released weekly to the public each Friday, is updated through the most recent Tuesday (data is 3 days old) and shows a quick view of how large speculators or non-commercials (for-profit traders) were positioned in the futures markets.
The CFTC categorizes trader positions according to commercial hedgers (traders who use futures contracts for hedging as part of the business), non-commercials (large traders who speculate to realize trading profits) and nonreportable traders (usually small traders/speculators) as well as their open interest (contracts open in the market at time of reporting).See CFTC criteria here.
Disclosure: Foreign Currency trading and trading on margin carries a high level of risk and can result in loss of part or all of your investment.Due to the level of risk and market volatility, ...
more

