
Signs Of Risk Appetite
BABY STEPS AWAY FROM FEAR
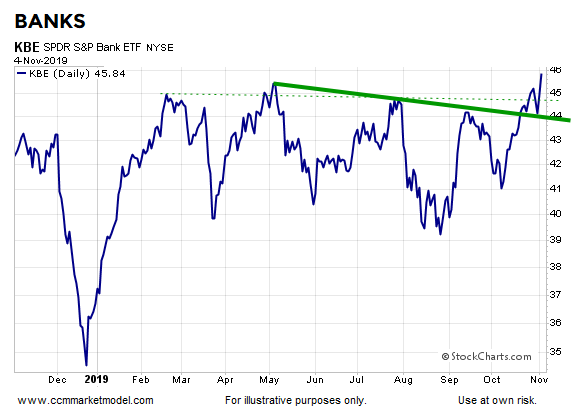
Despite very little hard evidence a recession was imminent, market participants have been highly risk-averse in recent months. While many of the charts below still have hurdles to clear, some incremental steps were recently taken away from the Armageddon narrative. Banks are trying to break out from a range that has been in place since February. KBE printed a new multi-month high Monday.
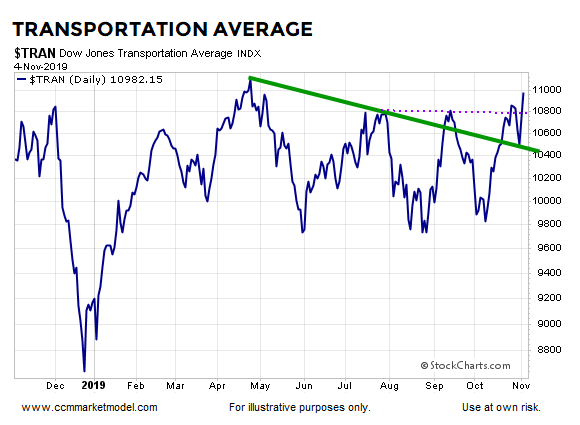
The Dow Jones Transportation Average still has some work to do, but it has taken some incremental steps and recently printed a multi-month high.
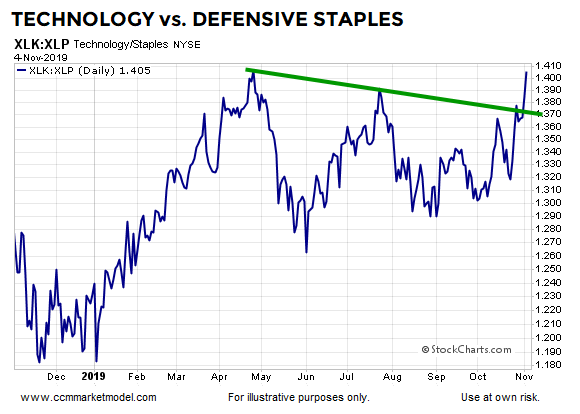
Tech stocks relative to consumer staples cleared a trendline that acted as resistance in April, July, and October.
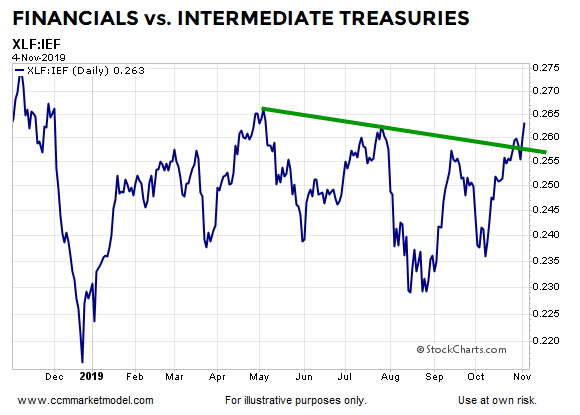
Financial stocks also made some “risk-on” progress relative to more defensive-oriented bonds.
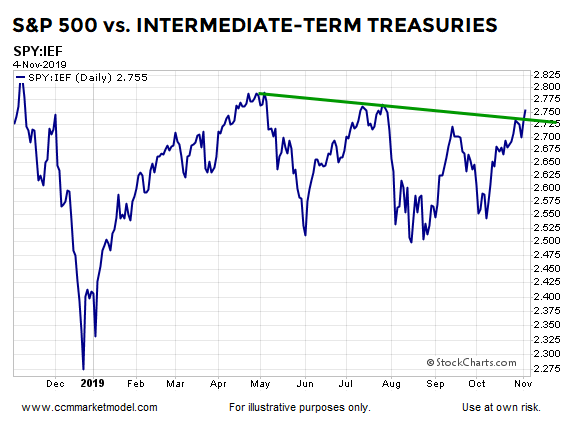
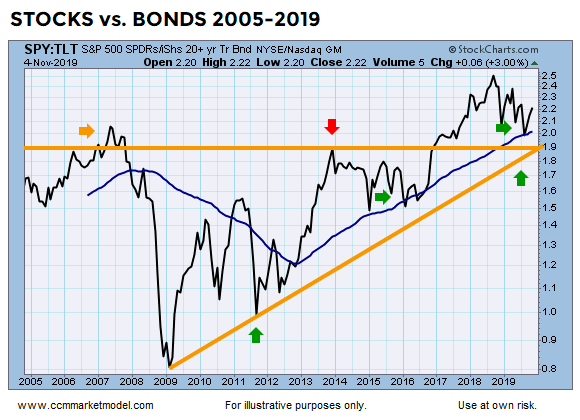
A similar “maybe the world is going to stay on its axis” look can be found on the chart showing the performance of the S&P 500 relative to bonds.
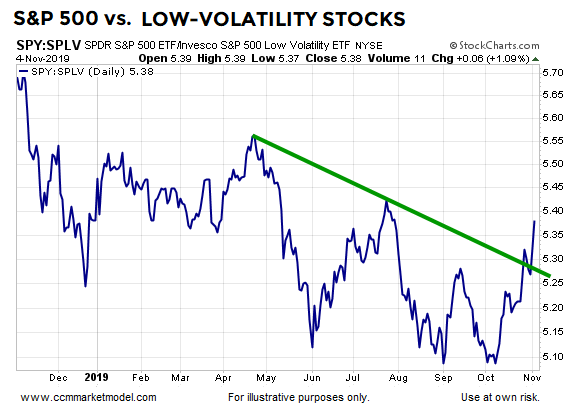
The trade war contributed to increasing conviction to own lower-volatility sectors. With trade rhetoric having moved into the “toned down” camp in recent weeks, the broader market has made some relative progress.
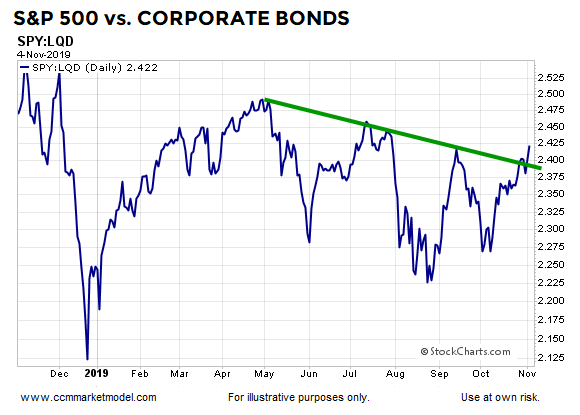
Monday’s session also featured the S&P 500/corporate bond ratio clearing a trendline that had rejected risk seekers in May, July, and October.
RARE LONG-TERM BULLISH SIGNALS AROUND THE GLOBE
Do longer-term setups tell us there is a realistic possibility of stocks continuing to march higher over the next one to five years? You can decide after reviewing the facts in this week’s video.
INTERMEDIATE AND LONG-TERM LOOKS
Treasury bonds turned down relative to the S&P 500 at important turning points for stocks in 2012, 2016, and 2018; the S&P 500 is shown at the bottom of the chart below as a “risk-on” reference point. The current look of the chart says good things could still happen for stocks relative to bonds.
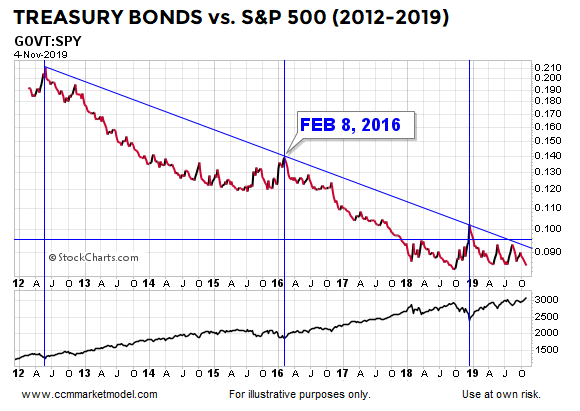
The same concepts apply from a much longer-term perspective when viewing the stock/bond ratio below. The ratio is trying to make a stand near an area that could act as major support and as a potential launching point for stocks relative to bonds.
THE MARKET HAS BEEN PROVIDING FACTUAL CLUES SINCE MID-JANUARY
The “be open to bullish outcomes” message is not particularly new. In fact, the blurb below comes from a Short Takes posted dated January 21, 2019:
In last week’s CCM stock market video, we noted the slope of the S&P 500’s 200-day moving average told us to keep an open mind about better than expected outcomes in the days, weeks, and months ahead. A recent development on the breadth front also falls into that bullish-open-mind category.
While it is never easy navigating near a major low (December 2018), the market has provided numerous “this does not look like a bear market” and “this does not look like a recession is underway” clues since the rare breadth thrust that was covered on January 21:
This Never Happened In The 1974, 2001, And 2008 Bear Markets
Rare Bullish Shift In P&F Buy Signals
Learning From The 1998, 2002, 2009, 2011, And 2016 Stock Market Lows
An Extremely Rare Move In Bonds, How Have Stocks And Bonds Performed In The Past?
What Typically Happens When These Charts Flip?
Are Institutions Selling Into This Rally?
Monthly Breadth: Dark Clouds Or A Ray Of Hope?
History Says Stocks Could Rocket Higher Over The Next Two Years
Do The Facts Support Gloom And Doom Or Higher Highs In Stocks?
2019 Market Action Points To Positive Long-Term Outcomes
The Bullish Message From The Stock/Bond Ratio
Are National Financial Conditions Saying The Stock Market Is In Big Trouble?
History Says Stocks Can Perform Very Well After Big Oil Shocks
Bulls Have Setups In Place For Monster Breakout
The Road Ahead May Be Brighter Than Expectations
Trade, Impeachment, And The Conviction Of Buyers And Sellers
Similar Drops In ISM Manufacturing Data
The Six Most Powerful Charts On Wall Street
Demographic Sweet Spot Says Bull Market Could Last Until 2035
Bulls Still Have Support For Upside Breakout
History Says Stocks Could Still Soar To Unimaginable Heights
VOLATILITY IS A NORMAL PART OF ALL TRENDS
As outlined in the posts above dated between January 21 and November 4, the market and economy have provided numerous reasons to keep an open mind about better than expected outcomes. Now that stocks are near an all-time high, it can be easy to forget all the volatility that took place between those two dates. The moral of the story is even IF really good things happen in the weeks, months, and years ahead, we can expect a ton of volatility and scary headlines along the way. We will continue to take it day by day with an open mind about all outcomes, from wildly bullish to wildly bearish.


