
Should We Be Singing The Inflation Blues?
I'm trying to make a living
I can't save a cent
It takes all of my money
Just to eat and pay my rent
I got the blues
Got those inflation blues
(From “Inflation Blues” by BB King, 1983)
I can't help but wonder what a man suppose to do
I got those hard breaking escalatin' high inflation blues
(From “High Inflation Blues” by Moe Bandy, 1977)

In this article, we continue with our deeper dives into different economic indicators, what we can learn by looking beyond the headline numbers and what those indicators might tell us about future economic and market conditions. In previous posts we discussed consumer sentiment and investor behavior and employment.
This time we discuss a topic that seems to be top-of-mind for many economists, advisors and investors: inflation. When Messrs. King and Bandy recorded their songs in the late-1970s/early-1980s, the U.S. was in one of the worst inflationary periods in its history, topping out at 14.6% in April 1980. We doubt either of those gentlemen would view today’s environment as “inflationary” as they knew it.
But is has been absent for so long that even a whiff of inflationary pressure raises questions and concerns, especially considering the recovering global economy, global easy-money policies and continued massive stimulus here in the United States. So, let’s dive in.
The Headline Numbers
Definitionally, inflation is simply a rise in prices and a corresponding decline in the purchasing power of money. Here in the U.S., the “headline” measures of inflation are the Consumer Price Index (CPI), a measure of the average price of a basket of goods and services, CPI ex-Food & Energy, which removes those two sectors because they tend to be volatile (these may seem ridiculous things to exclude to someone paying more for their gas and groceries), and the Personal Consumption Expenditures Index (PCE), which measures the change in household expenditures over a period of time. The Federal Reserve (Fed) tends to prefer the PCE when evaluating inflation because it accounts for changes in consumer behavior (e.g., substituting hamburger for steak) as prices change.
Here is how these three indicators currently look.
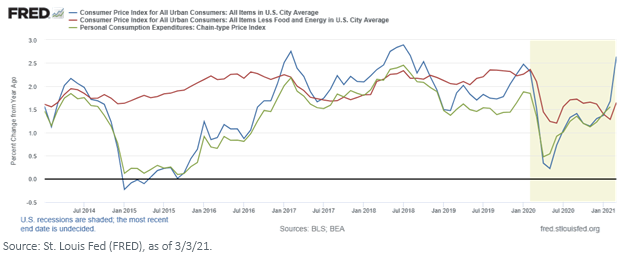
Given that the Fed’s historical target rate for inflation is 2%, these headline numbers do not give much cause for alarm, especially since the Fed has signaled it believes any near-term increase is likely transitory. The Fed has also indicated that it will allow inflation to run hot before stepping in, in order to pursue continued economic recovery.
The Numbers Behind the Numbers
Let’s now look at some of the “numbers behind the numbers.” We will focus on the two primary drivers of inflation – wages and input prices. Wages, because as workers earn more, they tend to consume more, and the laws of supply and demand suggest that tends to drive prices up. Input prices because, as the cost of “inputs” (e.g., raw materials, shipping costs, etc.) go up, companies will pass those increased prices through (as much as they can) to the end consumer in order to keep up their earnings.
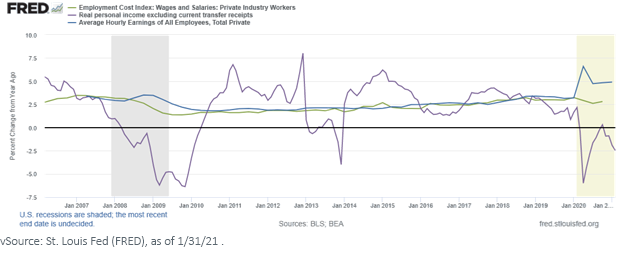
Three useful measures of wage inflation are: (1) the Employment Cost Index (ECI), published by the Bureau of Labor Statistics, which measures both wages and benefits at all levels of a company (and so it is probably the most comprehensive metric), (2) the Average Hourly Earnings of Employees, Total Private (since government workers are paid by the taxes on those earnings) and (3) Real Personal Income, Excluding Transfer Receipts (again, since transfer payments – social security, Medicare, Covid-19 relief, etc., are paid for by taxes on private sector earnings).
The current levels of these measures suggest we have not yet begun to see significant wage inflation. Average hourly earnings are rising as people return to work from the pandemic lockdown, but the ECI is stable and Real Personal Income is actually declining.
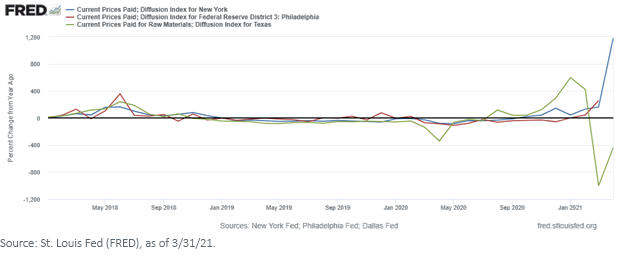
Finally, let’s look at input prices. Again, there are a handful of useful metrics. One is Current Prices Paid, which is calculated by some of the regional Federal Reserve Banks and measures how much companies are paying for their inputs. Here we perhaps see the first signs of true inflationary pressure.
Another useful metric is to measure the changing prices of commodities, which is an important input cost for many companies. A commonly reported metric is the Commodity Research Board (CRB) Index, which measures the changing prices of a defined basket of commodities. We prefer, however, to look at the changing prices of indexes tracking those individual commodity sectors. What we see is a steady rise over the past 12 months.

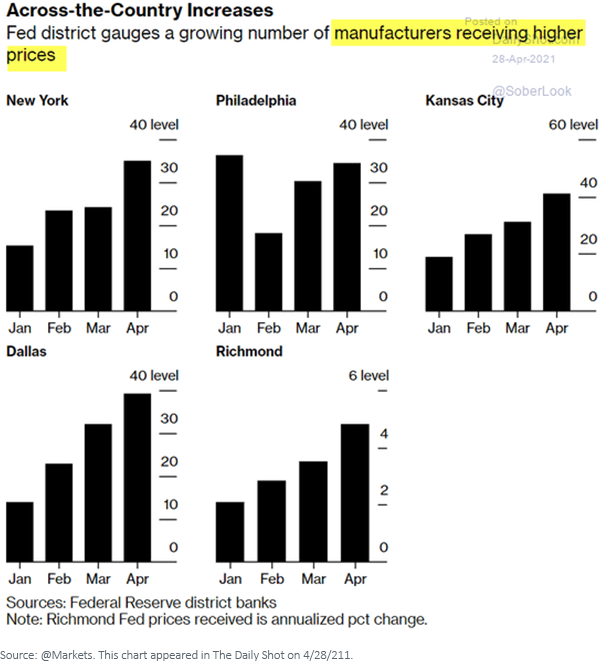
As noted above, companies increasingly are passing these increased input prices through to their end consumers – an exact example of input price inflation.
Conclusion
Based on the metrics we follow, it might be premature to be singing the “inflation blues.” But many of these metrics will almost certainly rise over the coming months as the global economy recovers, workers return to work and pent-up consumption demand is released.
The market likes a little inflation – it historically has been good for stocks. We will not be concerned until inflation rose to roughly 5% or above. But reflation is one of our primary investment themes for 2021 – we absolutely believe inflation is coming, and we suggest advisors and investors plan accordingly.
Disclaimer: Investors should carefully consider the investment objectives, risks, charges and expenses of the Funds before investing. U.S. investors only: To obtain a prospectus containing this ...
more

