
Should Treasury Bills Be The Risk-Free Asset In Asset Pricing Models?
In virtually all studies on asset pricing and asset pricing models, the one-month Treasury bill is the choice as the risk-free rate. In his study “The Risk-Free Asset Implied by the Market: Medium-Term Bonds instead of Short-Term Bills,” published in the September 2020 issue of The Journal of Portfolio Management, David Blitz challenged that choice. He began by noting that the choice of the one-month bill as the risk-free security was purely arbitrary and may even have been made out of the convenience of having the largest data set of independent periods. In fact, for investors with longer horizons, the one-month bill is not a riskless investment. It could certainly be argued that for an investor with an N-year horizon and real (nominal) liabilities, the N-year TIPS (nominal) Treasury bond is the risk-free asset.
Blitz then asked if the choice of the one-month Treasury is misspecified. If it is, and the true risk-free asset is a longer-maturity Treasury bond, what are the implications? One implication is that the equity risk premium would be much smaller, helping to resolve the so-called equity risk premium puzzle.
Blitz began his analysis by noting that if the true risk-free rate were a longer-term Treasury, it leads to the testable prediction that low-beta (high-beta) stocks should then exhibit positive (negative) bond betas. For example, if the equity beta is 0.7, the predicted bond beta is 0.3; if the equity beta is 1.3, the predicted bond beta is -0.3. In other words, if we subtract 1 from the equity beta, the predicted bond beta is equal to the remaining equity beta with the sign flipped—we should see an inverse linear relationship between equity betas and bond betas. Prior research, including the 2014 study “Interest Rate Risk in Low-Volatility Strategies,” the 2016 study “Understanding Defensive Equity,” and the 2017 studies “Interest Rate Exposure of Volatility Portfolios” and “Equity Portfolios with Improved Liability-Hedging Benefits,”found that stocks with low equity betas exhibit positive bond betas. In other words, low-beta stocks—which tend to be large, mature, profitable, and dividend-paying firms—are bond-like stocks.
To determine the best fit for the riskless rate, Blitz built value-weighted returns for 10 industry portfolios, 10 portfolios sorted on size, 10 portfolios sorted on operating profitability, 10 portfolios sorted on investment (one-year change in total assets), 10 portfolios sorted on earnings-to-price, 10 portfolios sorted on cash-flow-to-price, 10 portfolios sorted on dividend yield and the portfolio of zero-dividend stocks, 10 portfolios sorted on accruals (change in operating working capital), 10 portfolios sorted on net share issues, 10 portfolios sorted on residual variance (past 60 days) and 10 portfolios sorted on market beta (past 60 months). This yielded a total of 121 well-diversified portfolios as test assets. For the risk-free rate, Blitz considered 2-year, 5-year, 7-year, 10-year, and 30-year Treasuries. His sample period spanned more than half a century, from July 1963 to December 2018.
Following is a summary of his findings:
- There is a strong inverse linear relation between the estimated equity and bond betas; that is, the higher the equity beta, the lower the bond beta, and vice versa—portfolios with equity betas below 1 have positive bond betas, portfolios with equity betas above 1 have negative bond betas, and portfolios with a beta of 1 have a zero bond beta.
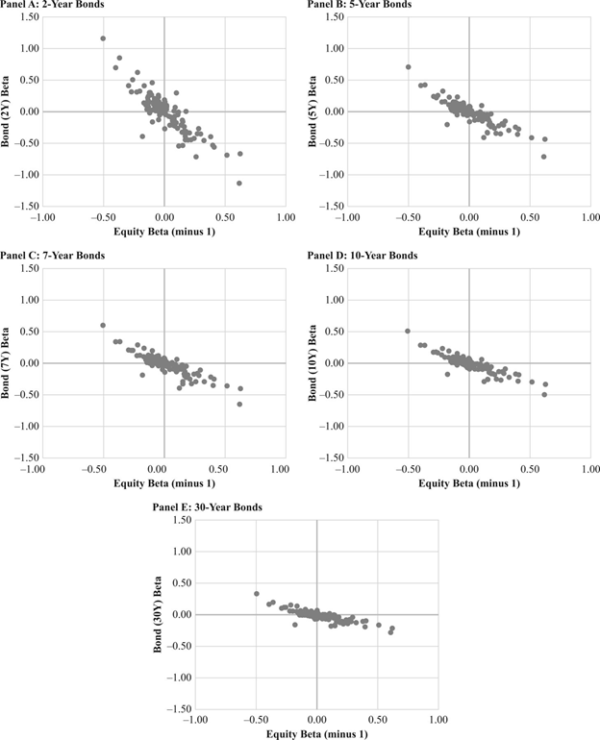
The results are hypothetical results and are NOT an indicator of future results and do NOT represent returns that any investor actually attained. Indexes are unmanaged, do not reflect management or trading fees, and one cannot invest directly in an index.
- The fit of the regressions is very strong, with adjusted R-squared levels ranging from 73% to 80%. and estimated intercepts are all statistically indistinguishable from zero.
- The slope coefficients are all negative, and highly statistically significant, with t-statistics of about -20, ranging from -0.40 for the 30-year bond asset to -1.54 for the 2-year bond asset.
- The coefficient that comes closest to the -1 level predicted is the -0.92 estimated slope for 5-year bonds, which also has the highest correlation.
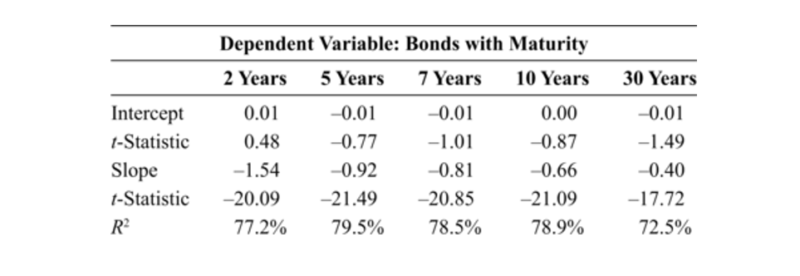
The results are hypothetical results and are NOT an indicator of future results and do NOT represent returns that any investor actually attained. Indexes are unmanaged, do not reflect management or trading fees, and one cannot invest directly in an index.
Robustness Test
As a test of robustness, the results were consistent over three subperiods of about the same length: July 1963 to December 1981, January 1982 to December 2000, and January 2001 to December 2018. The first subperiod is characterized by rising interest rates and hence low bond returns. The other two subperiods are characterized by high bond returns owing to falling interest rates. The explanatory power was consistently high, with R-squared levels ranging from over 75% in the middle subperiod to over 47% in the most recent subperiod. The best fit for the risk-free asset was for 2-year bonds in the first subsample, 7-year bonds in the middle subsample, and between 2- and 5-year bonds in the last subsample.
As a further test of robustness, Blitz examined whether the results for the U.S. market carry over to the main markets outside the United States—the United Kingdom, Japan, and the Eurozone. The universe consisted of all stocks in either the S&P Broad Market Index or FTSE Index at each point in time, giving an average of 482 stocks for the United Kingdom, 1,284 for Japan, and 861 for the Eurozone. The sample period is from January 1986 to December 2018 for the United Kingdom and Japan and, because of the introduction of the euro, from January 1999 to December 2018 for the Eurozone. Blitz found similar inverse relations between equity and bond betas in those markets as in the United States, as well as high correlations and intercepts that were all statistically indistinguishable from zero. For the United Kingdom and the Eurozone, the best fit for the risk-free security was the 10-year bond. For Japan, the 2-, 5- and 7-year maturities had similar results.
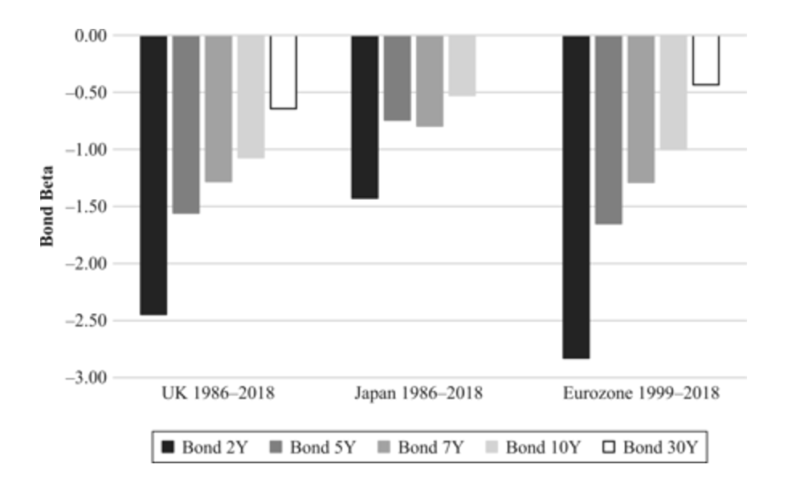
The results are hypothetical results and are NOT an indicator of future results and do NOT represent returns that any investor actually attained. Indexes are unmanaged, do not reflect management or trading fees, and one cannot invest directly in an index.
These findings led Blitz to conclude:
“The data are not only highly supportive of the theoretically predicted implications of a misspecified risk-free asset but also enable us to pinpoint the most appropriate choice for the risk-free asset as a bond with a maturity of about 5 years.”
Summary
Blitz found strong evidence that the risk-free rate used in asset pricing models is misspecified, as the empirical evidence provides support for intermediate-term Treasuries as the more appropriate benchmark. In addition to the empirical evidence, economic theory posits that the one-month rate is not a riskless rate for investors with horizons beyond that term. His findings help explain at least part of the equity risk premium puzzle. In addition, the evidence helps explain the performance of low-beta stocks.
Disclosure: Performance figures contained herein are hypothetical, unaudited and prepared by Alpha Architect, LLC; hypothetical results are intended for illustrative purposes only. Past ...
more

