
Service Sector PMIs Diverge
We look at hirings over openings when reviewing the JOLTS report. That’s why our articles sometimes differ from the headlines you find elsewhere. In September, job openings fell from 7.301 million to 7.024 million. The good news is the August reading was revised up from 7.051 million. Ultimately, job openings are meaningless if they don’t lead to hirings. That’s why we look at hirings closer.
As you can see from the chart below, openings growth was outlandish in relation to hirings growth in 2018 and early 2019. That divergence was unusual compared to the rest of the data since 2001. Now we are seeing the reverse of that mostly because of comps. Yearly openings growth was -5% and hirings growth was 4.7%.
Here is yoy change in openings against yoy change in hires. Striking and unprecedented divergence. But really reflects the fact that openings were off the charts last year. pic.twitter.com/ZrHmtWmo2j
— Sri Thiruvadanthai (@teasri) November 5, 2019
The spread between hirings and openings fell to 1.09 million which was the lowest since February 2018. Hirings growth improved from 1% last month. There were two months of contraction this spring. Growth is right in line with where it has been most of this cycle outside of a few weak periods during slowdowns.
Hirings growth in healthcare and social assistance was a solid 7.2% which is up from 0.7% in August. Manufacturing also had strong hirings growth as it improved from 1% to 4.7%. It’s interesting to see such strong growth in what is supposed to be a manufacturing slowdown. Leisure and hospitality has been criticized for being a strong industry for job growth in the recent BLS reports. Hirings growth improved from 5% to 5.4% here.
In September, the quits rate fell from 2.4% to 2.3%. This is still a relatively strong reading, but now it is 0.1% off its cycle high. Yearly quits growth fell from 3.7% to 3.1% which is still solid. The biggest change in the quits rate was in accommodation and food services which had it fall from 5.3% to 4.7%. Last month’s reading was a cycle high. Keep in mind, that this rate is volatile, so it probably doesn’t signal a trend change.
Very Poor Markit Services PMI
Both the Markit and ISM manufacturing PMIs improved slightly. However, the Markit services PMI fell slightly and the ISM non-manufacturing PMI improved decently. The two diverged.
As you can see from the chart below, the services PMI was the lowest since February 2016.
🇺🇸 US Services PMI ⬇️ to lowest since February 2016, posting at 50.6 in October (Sep - 50.9), as new business stagnated and export demand continued to fall. Job numbers dropped at the quickest pace for almost a decade. More here: https://t.co/LNsRm6O2Ec pic.twitter.com/EMRTTQk4Mw
— IHS Markit PMI™ (@IHSMarkitPMI) November 5, 2019
The October PMI fell from 50.9 to 50.6 which is down significantly from the flash reading of 51. That means the 2nd half of the month had a PMI of just 50.2. The weakness in the service sector PMI caused the composite PMI to fall from 51 to 50.9 even though the manufacturing PMI improved 0.2 to 51.3.
The new business index was also weak as it fell below 50 for the first time since the data started being collected 10 years ago. New export orders fell for the 3rd straight month, but the contraction moderated slightly. This was the 2nd worst reading in its history (stand-alone series began in September 2014). The decline in employment increased as this was the worst reading in almost 10 years. Backlogs fell for the 3rd straight month. The slight rise in prices paid was the first increase since July. Prices received were flat which ended a 2 month streak of declines. Surprisingly, even though this report was mostly weak, the output outlook for the next year improved slightly to a 4 month high. Anecdotal evidence (from the report) suggests new service lines and low rates caused firms to be more optimistic.
The composite PMI is consistent with just 1.5% GDP growth which in line with the median of 8 estimates for Q4 GDP growth. The comment section of this report stated the employment index’s weakness will filter to the official employment numbers soon. That obviously didn’t occur in the last BLS reading which was strong and had two positive revisions.
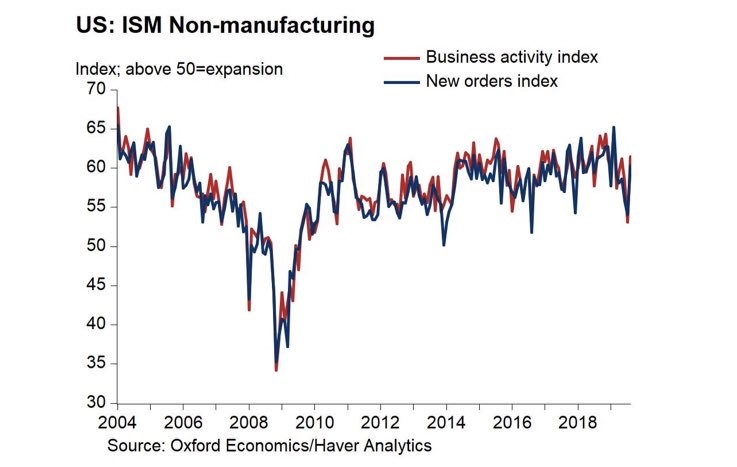
ISM Non-Manufacturing PMI Improves
As we mentioned, the non-manufacturing ISM PMI improved decently; it increased from 52.6 to 54.7 as it now implies GDP growth will be 2.1%. That’s a bit higher than Markit’s projection for 1.5% growth and the consensus estimate. The PMI beat estimates for 53.5 and the high end of the estimate range which was 54.4. As the chart below shows, the business activity index improved from 55.2 to 57. 13 industries saw business activity improve and 3 saw it decline.
(Click on image to enlarge)
The new orders index was up 1.9 to 55.6. Much different from the Markit report, the employment index increased 3.3 points to 53.7. Similar to the Markit report, the backlog of orders index was weak as it fell 5.5 points to 48.5.
Trade War Could Be Simmering Down
In the comment section of the ISM report, 3 of 9 quotes mentioned the trade war. A wholesale trade firm stated, “Business is still lower than this time last year due to tariff issues and a soft market.” Businesses will be happy to hear the news that phase 1 of the trade deal might be nearly wrapped up. Trump stated this is about 60% of the total deal, meaning it is significant. China is trying to get the US to remove some of its tariffs. According to the Financial Times, the White House is considering rolling back the 15% tariff on $112 billion worth of goods that was put in place on September 1st.
A trade deal and fewer tariffs would lower business uncertainty which could increase investment. Remember, business investment was negative in Q3. As you can see from the chart below, the regional Fed manufacturing reports saw decreases in their expected capex indexes after the trade war was ratcheted up. That’s not the only reason they fell, but it is a factor.
Still thinking more about magnitude of effect but trade war & associated uncertainty really is crushing business confidence: pic.twitter.com/2Z6muq3EfY
— Donald Schneider (@DonFSchneider) October 30, 2019
Conclusion
The JOLTS report was strong because hirings growth was up. Openings are falling because they got way too high in 2018. Openings that don’t lead to hirings are meaningless. The Markit and ISM manufacturing PMIs were in line, but their service sector PMIs diverged. The Markit PMI was quite terrible, while the ISM PMI showed decent improvement. If phase 1 of the trade deal is completed, it will lower business uncertainty which could improve business investment which was a drag on Q3 GDP growth. It could also help the expected capex indexes in the regional Fed manufacturing reports. In theory, that would imply improvement in industrial production growth.
Disclaimer: Please familiarize yourself with our full disclaimer here.


