
Screening For High-Quality Stocks With Superior Profitability
Investing in high-quality stocks can be a great strategy to obtain superior returns over the long term. Few investors would disagree with that statement. However, implementation is the key part. Quality can be defined in multiple ways, and finding high-quality stocks is much easier said than done.
Nevertheless, business quality can also be measured through financial indicators and profitability ratios, and superior profitability over the long term is many times a sign of superior fundamental quality too.
Success attracts competitive pressure in the business world. When a company is doing well in a particular market, chances are that the competition will try to intensify the pressure to steal some of those profits. Only the companies with superior fundamental quality and competitive strengths can sustain above-average profitability levels over long periods of time.
The following screener looks for companies with superior profitability across the board by relying on metrics like operating profit margins, return on equity, and return on investment. The main idea is focusing on different kinds of profitability metrics in order to find companies with consistently superior quality across different indicators.
Strategy Design
To begin with, the screener considers only companies with a market capitalization value above $250 million. This requirement has a negative impact on returns because many times the small companies are the ones that deliver the bigger gains. However, it makes sense to guarantee a minimum size for inclusion in the screen due to risk and liquidity considerations.
After that, the screener measures companies based on 3 different profitability ratios: operating profit margin, return on equity, and return on investment. The average value for the three ratios needs to be above zero over the past five years and also above the industry average.
Operating profit margins measure profits at the operating level as a percentage of revenue. Companies that can retain a larger share of revenue as operating profit can obviously generate more value for shareholders over time. Besides, high operating margins make a company more resilient and more capable of withstanding economic headwinds.
Return on equity reflects management's ability to translate each dollar in shareholder equity into net income. The higher the return on equity, the higher the value of that equity, and companies that can generate high ROEs over the long term can produce accumulate compounded profits at an impressive speed.
The main drawback of ROE is that it can be affected by financing decisions such as financial leverage. Companies that issue debt can generate a higher return on equity than those with more conservative debt levels. This is not necessarily a bad thing, and sometimes issuing low-cost debt is, in fact, the smart thing to do. However, financial leverage also increases the risk for investors.
This is why ROI can be a good complementary metric to use with ROE. ROI is measured as the income after taxes divided by total long-term debt and stockholders' equity. If a company has too much debt, this has a negative impact on ROI levels.
By requiring the three profitability metrics to be above zero, the screen avoids companies that are losing money. This may sound simplistic, but sticking with businesses that generate positive earnings as opposed to burning money can be an effective way to avoid many of the most expensive mistakes in the market.
From a starting universe of nearly 6,600 stocks, we get only 1,300 names that meet the criteria for profitability across the three ratios stated above. Among those companies, the screener selects the 30 companies with the highest Return On Investment Capital (ROIC) ratio.
Summing up the screener criteria:
- Only companies with a market capitalization value above $250 million are considered.
- The average value of Operating Margin, ROE, and ROI needs to be positive in the past five years.
- The average value of Operating Margin, ROE, and ROI needs to be above the industry average in the past five years.
- Among the companies that meet the criteria above, the screener selects the top 30 names based on ROIC levels.
Backtested Returns
The portfolio selected by the screener is equally weighted and rebalanced every 52 weeks. Trading expenses are assumed to be 0.2% per transaction, and the benchmark is the SPDR S&P 500 (SPY) ETF.
Since January of 1999, the high-profitability screen gained 14.72% per year, more than double the 6.77% delivered by SPDR S&P 500 in the same period. In cumulative terms, the strategy gained 1698% versus 297% for the benchmark. Alpha for the quantitative strategy was 8.26% annually.
(Click on image to enlarge)
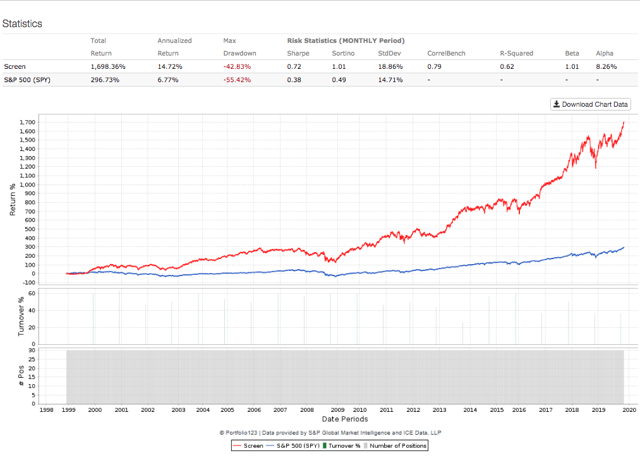
Data from S&P Global via Portfolio123
It is interesting to note that the strategy is more volatile than the benchmark as measured by the standard deviation. However, the maximum drawdown, meaning maximum capital loss from the peak, is smaller for the high-quality screener than for the benchmark. This makes sense because high-quality stocks generally tolerate market volatility better than other kinds of stocks.
On the other hand, even if the strategy tends to outperform over multiple years, it can also underperform in specific periods, and it has, in fact, underperformed the benchmark in the past year. This is no surprise at all since all kinds of factors and quantitative strategies underperform their benchmark in some periods, even the ones with the best returns over the long term.
Providing more details, the table below shows returns and risk-adjusted return metrics for the quantitative screen versus the benchmark over different timeframes.
(Click on image to enlarge)
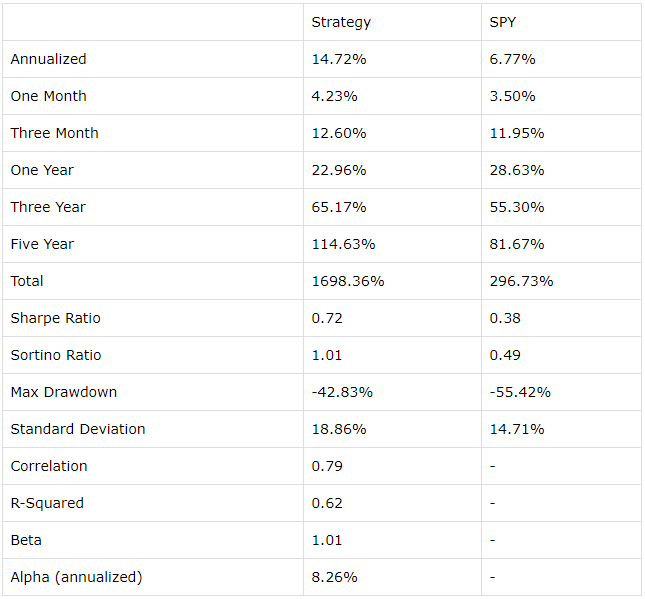
Data from S&P Global via Portfolio123
Practical Considerations And Portfolio
It is of utmost importance to understand that a quantitative screener is a list of interesting ideas for further research. Investors should never buy a stock simply because the profitability metrics are strong. We need to understand the main business drivers behind these profitability metrics in order to asses if the business can sustain those metrics or not in the future.
Quantitative screeners are always based on currently available data and sometimes also on expectations about future data. This has some important advantages because investment decisions based on hard data and numbers are generally much more effective than investing based solely on opinions and subjectivities.
However, sometimes the numbers don't tell you everything you need to know to assess an investment. If a company has produced superior profitability based on a specific set of competitive advantages and those advantages are declining in strength, then past performance is no valid guide to the future.
Another important consideration is that the screener does not incorporate any criteria for valuation. High-quality stocks generally deserve to trade at above-average valuation levels. However, excessive valuations can hurt returns for investors, even when the business fundamentals remain intact.
Investors may want to keep a close eye on valuation levels for the stocks in the portfolio, especially in times when the market is trading at all-time highs and high-quality stocks as a group have significantly outperformed the market in the past two decades.
It would have been relatively easy to incorporate some valuation ratios in the screener in order to address this issue. However, the main idea is focusing on how quality alone - irrespective of valuation levels - can drive superior returns for investors. That notwithstanding when analyzing the positions in the portfolio, valuation is a key factor to watch.
Also, the screener does not include any requirement for diversification across different sectors, and it tends to overweight the sectors in which profitability levels are generally higher. Technology, for example, has a much larger weight than materials in the screener.
This means that the performance of the stocks selected by the screener will depend to a considerable degree on the performance of the particular sectors that get larger participation in the portfolio, and concentration risk should not be disregarded.
Those considerations being fully acknowledged, the table below shows the 30 stocks currently selected by the quantitative screen. Data in the table also includes market capitalization in millions and the average value for operating margin, ROI, and ROE over the past five years.
| Ticker | Name | Mkt Cap | OM 5YAvg |
ROI 5YAvg |
ROE 5YAvg |
| JOBS | 51job Inc | $6,022 | 29.06 | 11.09 | 13.15 |
| ANET | Arista Networks Inc | $16,944 | 26.38 | 21.01 | 22.59 |
| APAM | Artisan Partners Asset Management Inc | $1,967 | 35.81 | 29.58 | 82.37 |
| ATHM | Autohome Inc | $10,358 | 31.49 | 25.31 | 25.49 |
| BMA | Banco Macro SA | $2,112 | 44.02 | 18.61 | 23.65 |
| BA | Boeing Co | $182,428 | 9.18 | 50.05 | 942.76 |
| CYOU | Changyou.com Ltd | $543 | 20.49 | 7.51 | 10.42 |
| HLG | Hailiang Education Group Inc | $1,739 | 22.17 | 17.76 | 17.76 |
| HTBK | Heritage Commerce Corp | $548 | 54.31 | 8.82 | 9.64 |
| INS | Intelligent System Corp | $355 | 0.94 | 1.11 | 1.11 |
| INTU | Intuit Inc. | $73,641 | 25.76 | 35.8 | 52.49 |
| MANH | Manhattan Associates Inc | $5,447 | 28.69 | 60.14 | 60.14 |
| MA | Mastercard Inc | $326,897 | 54.95 | 44.06 | 71.57 |
| MED | Medifast Inc. | $1,342 | 12.46 | 28.81 | 28.87 |
| NTES | Netease Inc | $44,763 | 23.2 | 21.74 | 23.89 |
| EGOV | NIC Inc | $1,511 | 23.18 | 37.51 | 37.51 |
| NVO | Novo Nordisk A/S | $146,776 | 41.68 | 74.06 | 75.18 |
| OFLX | Omega Flex Inc | $1,100 | 24.15 | 36.99 | 36.99 |
| PETS | PetMed Express Inc | $550 | 15.55 | 28.54 | 28.54 |
| PFBC | Preferred Bank of Los Angeles | $874 | 57.23 | 11.13 | 13.53 |
| QIWI | QIWI plc | $1,231 | 22.22 | 28.34 | 29.67 |
| SPGI | S&P Global Inc | $72,535 | 42.08 | 34.67 | 263.52 |
| SFBS | ServisFirst Bancshares Inc | $1,980 | 58.49 | 9.87 | 17.27 |
| AMTD | TD AMERITRADE Holding Corp | $27,488 | 44.5 | 14.37 | 18.74 |
| TPL | Texas Pacific Land Trust | $6,149 | 86.15 | 124.62 | 133.48 |
| OTCPK: TMICY | Trend Micro Inc | $7,369 | 25.1 | 14.83 | 14.83 |
| UI | Ubiquiti Inc | $11,232 | 33.81 | 33.8 | 66.3 |
| USNA | USANA Health Sciences Inc | $1,759 | 14.8 | 30.62 | 30.59 |
| VEEV | Veeva Systems Inc | $21,968 | 22.6 | 15.39 | 15.74 |
| YRD | Yirendai Ltd | $369 | 25.8 | 34.4 | 34.51 |
Disclaimer: I wrote this article myself, and it expresses my own opinions. I am not receiving compensation for it. I have no business relationship with any company whose stock is mentioned in ...
more

