
Record Decline In Empire Manufacturing Report
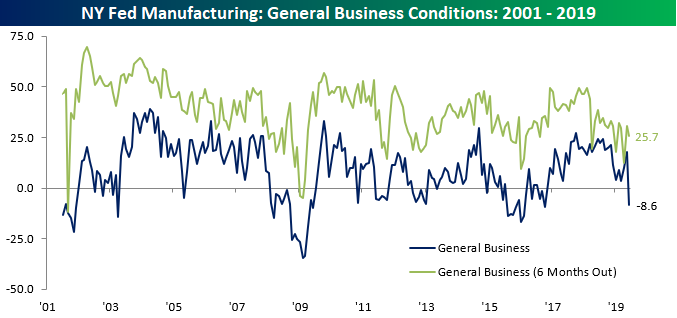
After month/month increases in three of the four prior months, the June Empire Manufacturing report fell and fell hard. While economists were expecting the headline index to drop from 17.8 down to 11.0, the actual decline was much larger sending the headline index down to negative 8.6. With the June decline, the Empire Manufacturing index saw its first negative reading since the 2016 election, the weakest decline relative to expectations since June 2011, and the largest m/m decline in the history of the survey dating back to 2001. One caveat to the decline, however, may be that the temporary trade spat with Mexico may have contributed to the weakness. We’ll have to wait until more data for the month comes in, though, for more clarity on that front.
While current conditions plummeted, the expectations component of the report saw a much more modest decline, falling from 30.6 down to 25.7.
(Click on image to enlarge)
As if the decline in the headline index wasn’t large enough, the text of the report may have been even worse. The first paragraph alone was filled with descriptors like “sharp turn downward,” “plummeted,” “largest monthly decline on record,” “receded,” “fell,” “slightly lower,” “small declines,” “price increases slowed,” and “less optimistic.”On top of that, the titles of the paragraphs that followed were “Growth Abruptly Reverses,” “Employment Shrinks,” and “Futures Indexes Decline.”Happy Monday!
As far as the internals of the report were concerned, every component of the Current Conditions declined except for Prices Paid, while on the Outlook side of the table (Six Months Out), all but two components (Prices Paid and Average Workweek) declined.
(Click on image to enlarge)

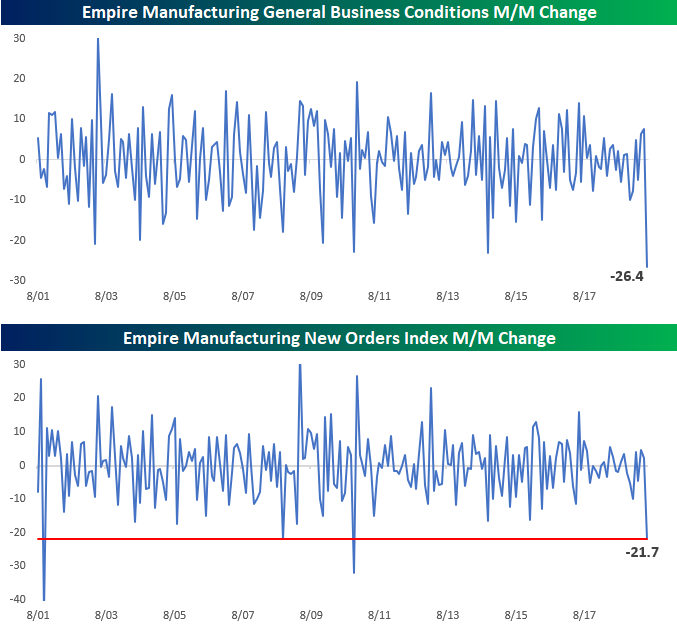
We already mentioned that the headline General Business index saw a record m/m decline, and we highlight that in the first chart below. It wasn’t only the General Business Index that saw a steep decline, though. As shown in the second chart below, the New Orders component also dropped over 20 points, which was the third largest m/m decline on record. The only times the index saw steeper declines were just after 9/11, after the Lehman bankruptcy, and in November 2010.
(Click on image to enlarge)
Start a two-week free trial to Bespoke Institutional to access all of our interactive tools and best stock ...
more

