
Using Average Dividend Yield For Dividend Growth Stock Valuation
Dividend growth investing focuses on investing in businesses with a strong track record of rewarding shareholders through ever-increasing dividend payments. I consider dividend growth stocks to be stocks that have paid higher dividends for at least 5 consecutive years.
Finding high-quality dividend growth stocks is an important part of dividend growth investing. But investing in such stocks when their prices are inflated, is not a sound investment strategy. For this reason, I use various stock valuation methods to find undervalued stocks.
A quick method is to use a stock's historical average dividend yield. If the stock is of a stable business that regularly pays and raises its dividends, the stock's dividend yield will tend to revert to its historical average dividend yield over time. And the stock price corresponding to the historical average dividend yield will be a reasonable estimate of fair value for the stock.
Dividend Yield
Dividend yield is defined as a stock's annual dividend expressed as a percentage of the current stock price:
yield = 100 × annual dividend / stock price
The current stock price is the last price at which the stock traded, but what is the annual dividend? Except for companies that pay annual dividends, the term annual dividend is unclear. We can annualize monthly, quarterly or semi-annual dividends, but over which period?
Arguing there is no guarantee that future dividends will match past dividends, some analysts prefer to use only paid dividends in yield calculations. Variations include the total dividends paid in the last calendar year, the last fiscal year, or the trailing twelve months. A dividend yield calculated this way is called the trailing dividend yield.
For dividend growth stocks (as defined above), I expect future dividends to continue to exceed past dividends. Therefore, I annualize either the last paid dividend or an announced increased dividend to calculate dividend yield. A dividend yield calculated this way is called the forward dividend yield.
In my view, trailing dividends are misleading because they do not account for dividend increases or cuts. Forward dividends represent the best available information at the time of calculation. Note there is an inverse relationship between dividend yield and stock price. If the stock price increases, the dividend yield decreases, and vice versa. Here is a 5-year price and yield chart of Johnson & Johnson (JNJ), clearly showing this inverse relationship:
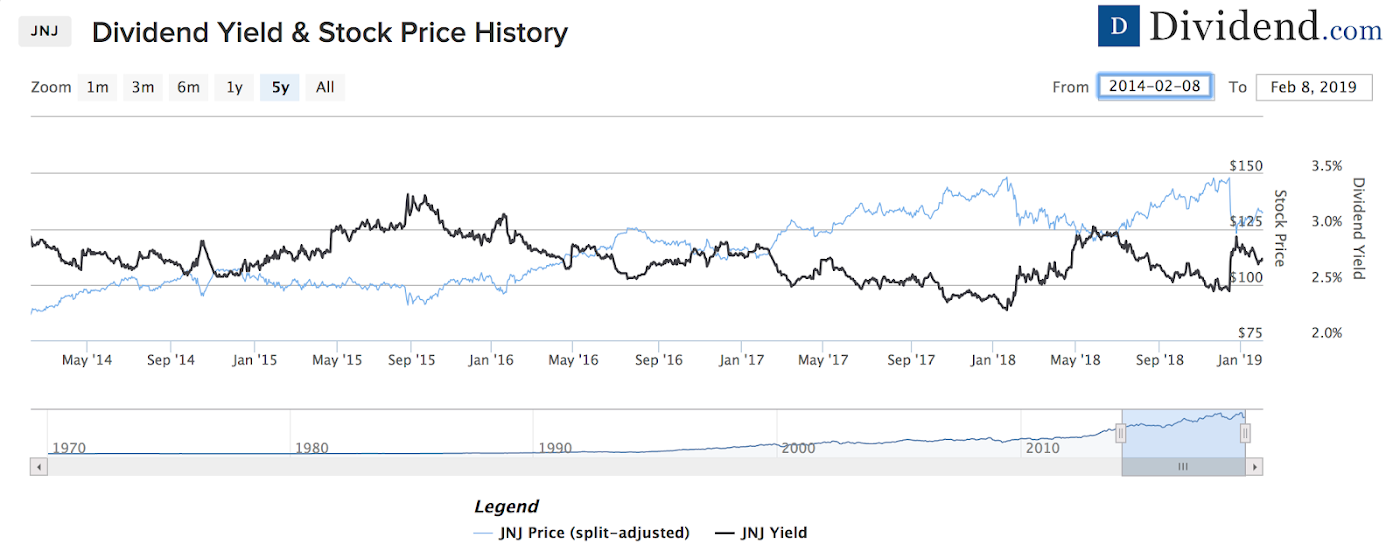
In August 2015, JNJ's dividend yield topped out at 3.31% when the stock price dropped to $90.73 per share. Conversely, in January 2018, JNJ's dividend yield bottomed out at 2.27% when the stock price climbed to $148.14 per share.
Average Dividend Yield
The average dividend yield of JNJ over the last 5-years is 2.72%.
Looking at the chart of JNJ, when the dividend yield is much higher than the average dividend yield, it seems to be a good time to buy the stock. And when the dividend yield is much lower than the average dividend yield, it seems to be a poor time to buy the stock. Furthermore, it is clear that the dividend yield does not stay at the extreme levels for too long.
These observations form the basis of dividend yield theory, which asserts that the dividend yield of stable dividend-paying stocks tends to revert to the mean.
In essence, a dividend-paying stock is more attractive when it offers a high dividend yield. Investors pile in and the stock price begins to move higher, resulting in declining dividend yield. When the dividend yield deteriorates to a level that no longer attracts investors, buying slows down and the stock price finds a top. With little investor demand (and profit taking), the stock price starts to decline. When the stock price reaches a level where the dividend yield again attracts investors, the cycle repeats itself.
Dividend yield theory is the basis of IQT's long-term investment strategy, as outlined in the 1990 book Dividends Don't Lie: Finding Value in Blue-Chip Stocks, by Geraldine Weiss, and the 2010 sequel Dividends Still Don't Lie: The Truth About Investing in Blue Chip Stocks and Winning in the Stock Market, by Kelley Wright. According to Wright, "dividend-paying stocks fluctuate over time within a range of low dividend yield—establishing a peak of overvalue—and high dividend yield—establishing a valley of undervalue". The peaks and valleys indicate areas where a stock should be bought or sold.
Stock Valuation
I like the notion of comparing a stock's dividend yield to its own historical average dividend yield. It provides a simple way to do stock valuation.
Let's take another look at JNJ. With a 5-year average dividend yield of 2.73%, what is a reasonable fair value estimate of JNJ? Assuming that no dramatic events will impact JNJ's business, then the average dividend yield can be used to calculate a reasonable fair value price. Just rearrange the dividend yield formula:
dividend yield = 100 × annual dividend / current stock price
as follows:
fair value price = 100 × annual dividend / average dividend yield
JNJ's forward dividend is $3.60, so a reasonable fair value of JNJ is:
fair value price = 100 × 3.60 / 2.72 = $131.87 or about $132
For comparison, Morningstar's fair value is $130 and finbox.io's fair value is $126.11.
With JNJ trading at about $132 per share, the stock appears to be fairly valued.
To determine price targets where JNJ would be undervalued or overvalued, consider the stock's 5-year dividend yield range, from the high dividend yield of 3.31% to the low dividend yield of 2.27%. That represents a range of about 1.0%.
If we use approximately 10% on either end of this range to signify extreme dividend yields, then undervalued would be at 3.31% – 0.1% = 3.21%, while overvalued would be at 2.27% + 0.1% = 2.37%.
undervalued target = 100 × 3.60 / 3.21 = $112.15 or about $112
overvalued target = 100 × 3.60 / 2.37 = $151.90 or about $152
Should JNJ's stock price decline by about 15% to $112 or below, the stock would be undervalued. And should the stock price increase by about 15% to $152 or above, the stock would be overvalued.
Calculating undervalued and overvalued targets using the average dividend yield of a stock can help investors establish good entry and exit points.
Buying dividend growth stocks when undervalued not only locks in high yield but offers the best opportunity to benefit from stock price increases. And selling dividend growth stocks when overvalued locks in profits, and offers more opportunities to deploy the proceeds in undervalued stocks with higher yields.
Valuations of Select Dividend Growth Stocks
My portfolio contains 73 dividend growth stocks. Below is a table of fair value estimates, and undervalue and overvalue targets, for a selection of these stocks.
|
Ticker Symbol |
Annual Dividend |
Dividend Yield |
5-year Average Yield |
Recent Stock Price |
Fair Value Estimate |
Undervalue Target |
Overvalue Target |
| ABBV | $ 4.28 | 5.37% | 3.62% | 80 | 118 | 85 | 152 |
| AFL | $ 1.08 | 2.24% | 2.40% | 48 | 45 | 38 | 51 |
| AMGN | $ 5.80 | 3.12% | 2.34% | 186 | 248 | 193 | 354 |
| APD | $ 4.64 | 2.80% | 2.68% | 166 | 173 | 134 | 197 |
| BLK | $ 13.20 | 3.21% | 2.49% | 412 | 531 | 431 | 637 |
| CB | $ 2.92 | 2.24% | 2.03% | 130 | 144 | 128 | 166 |
| CMI | $ 4.56 | 3.08% | 2.65% | 148 | 172 | 110 | 240 |
| CVX | $ 4.76 | 4.05% | 3.88% | 118 | 123 | 92 | 146 |
| D | $ 3.67 | 5.02% | 3.89% | 73 | 94 | 73 | 111 |
| DLR | $ 4.04 | 3.60% | 4.42% | 112 | 91 | 63 | 115 |
| ES | $ 2.02 | 2.88% | 3.28% | 70 | 62 | 56 | 70 |
| FRT | $ 4.08 | 2.99% | 2.84% | 137 | 144 | 121 | 175 |
| GD | $ 4.65 | 2.70% | 2.12% | 172 | 220 | 150 | 275 |
| HRL | $ 0.84 | 1.96% | 1.79% | 43 | 47 | 38 | 58 |
| ITW | $ 4.00 | 2.95% | 2.19% | 136 | 182 | 132 | 207 |
| KO | $ 1.56 | 3.15% | 3.16% | 50 | 49 | 44 | 57 |
| LMT | $ 8.80 | 2.92% | 3.09% | 302 | 285 | 178 | 345 |
| LOW | $ 1.92 | 1.98% | 1.72% | 97 | 111 | 91 | 145 |
| MCD | $ 4.64 | 2.66% | 3.02% | 175 | 153 | 131 | 187 |
| MDT | $ 2.00 | 2.25% | 2.04% | 89 | 98 | 86 | 122 |
| MMM | $ 5.44 | 2.72% | 2.48% | 200 | 220 | 195 | 268 |
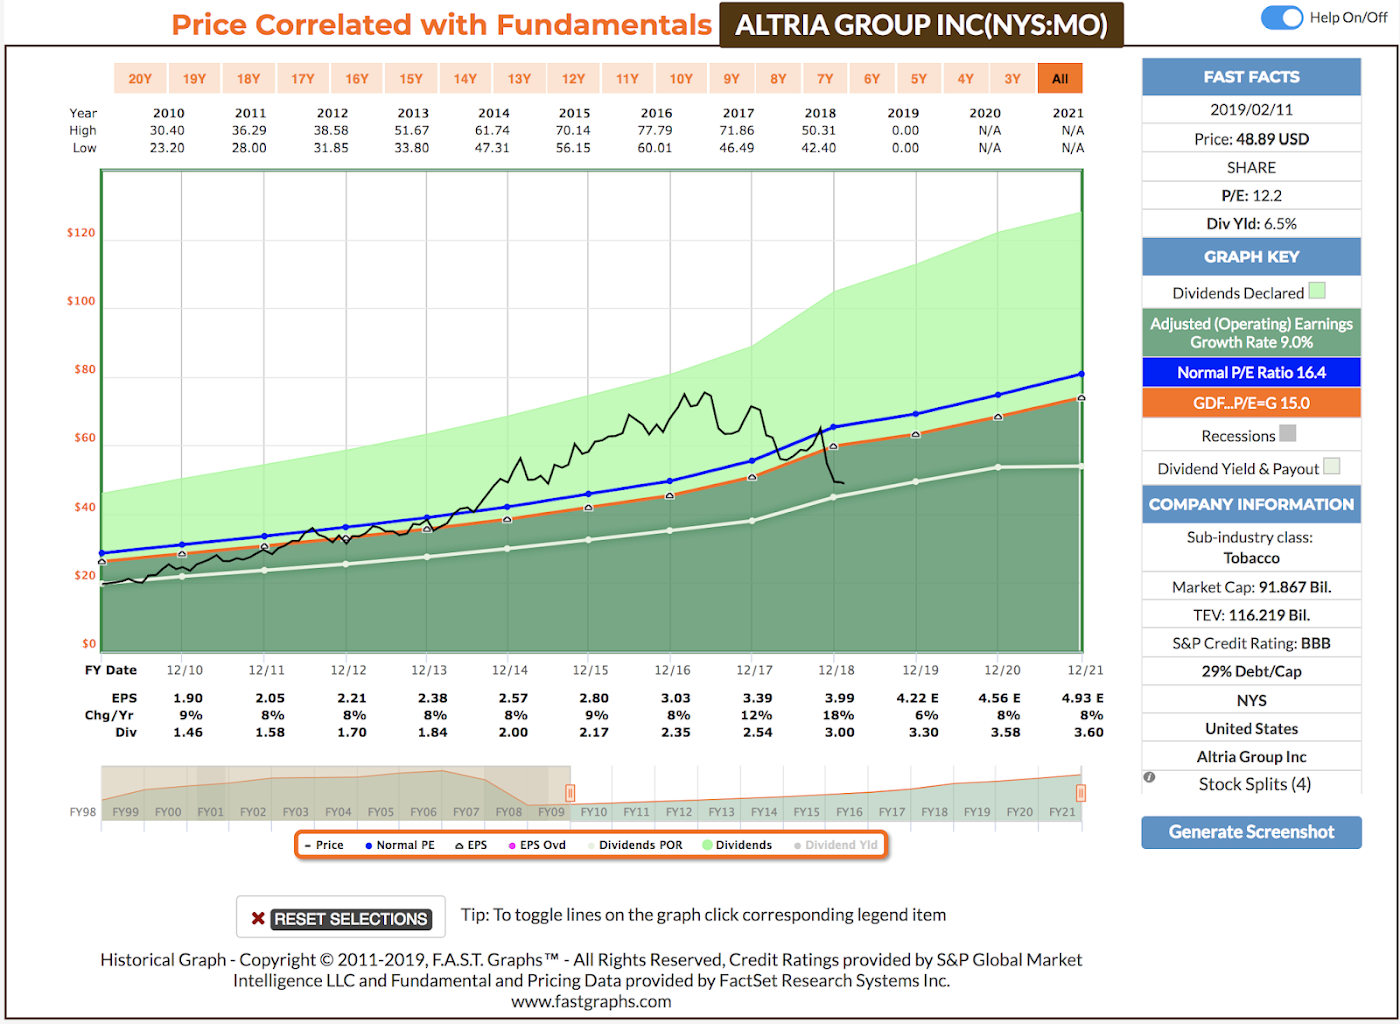
| MO | $ 3.20 | 6.55% | 4.38% | 49 | 73 | 52 | 90 |
| MSFT | $ 1.84 | 1.74% | 2.50% | 106 | 74 | 58 | 109 |
| NEE | $ 4.44 | 2.43% | 2.90% | 183 | 153 | 125 | 173 |
| NNN | $ 2.00 | 3.76% | 4.42% | 53 | 45 | 39 | 58 |
| O | $ 2.71 | 3.86% | 4.64% | 70 | 58 | 48 | 76 |
| PG | $ 2.87 | 2.94% | 3.20% | 98 | 90 | 74 | 98 |
| QCOM | $ 2.48 | 4.93% | 3.18% | 50 | 78 | 53 | 133 |
| ROST | $ 0.90 | 0.97% | 0.98% | 93 | 92 | 75 | 109 |
| RTN | $ 3.47 | 1.97% | 2.28% | 176 | 152 | 97 | 204 |
| SKT | $ 1.40 | 6.26% | 3.91% | 22 | 36 | 22 | 50 |
| SWK | $ 2.64 | 2.08% | 2.07% | 127 | 128 | 105 | 165 |
| T | $ 2.04 | 6.90% | 5.37% | 30 | 38 | 30 | 43 |
| TJX | $ 0.78 | 1.59% | 1.31% | 49 | 59 | 45 | 78 |
| TROW | $ 2.80 | 3.03% | 2.55% | 92 | 110 | 87 | 142 |
| TRV | $ 3.08 | 2.45% | 2.30% | 126 | 134 | 123 | 155 |
| TXN | $ 3.08 | 2.95% | 2.63% | 105 | 117 | 96 | 135 |
| UNP | $ 3.20 | 1.98% | 2.15% | 162 | 149 | 111 | 177 |
| VZ | $ 2.41 | 4.47% | 4.52% | 54 | 53 | 48 | 61 |
| WBA | $ 1.76 | 2.51% | 2.03% | 70 | 87 | 64 | 108 |
| WEC | $ 2.36 | 3.16% | 3.41% | 75 | 69 | 62 | 76 |
| WPC | $ 4.12 | 5.46% | 5.90% | 75 | 70 | 63 | 88 |
| XEL | $ 1.52 | 2.84% | 3.46% | 53 | 44 | 39 | 52 |
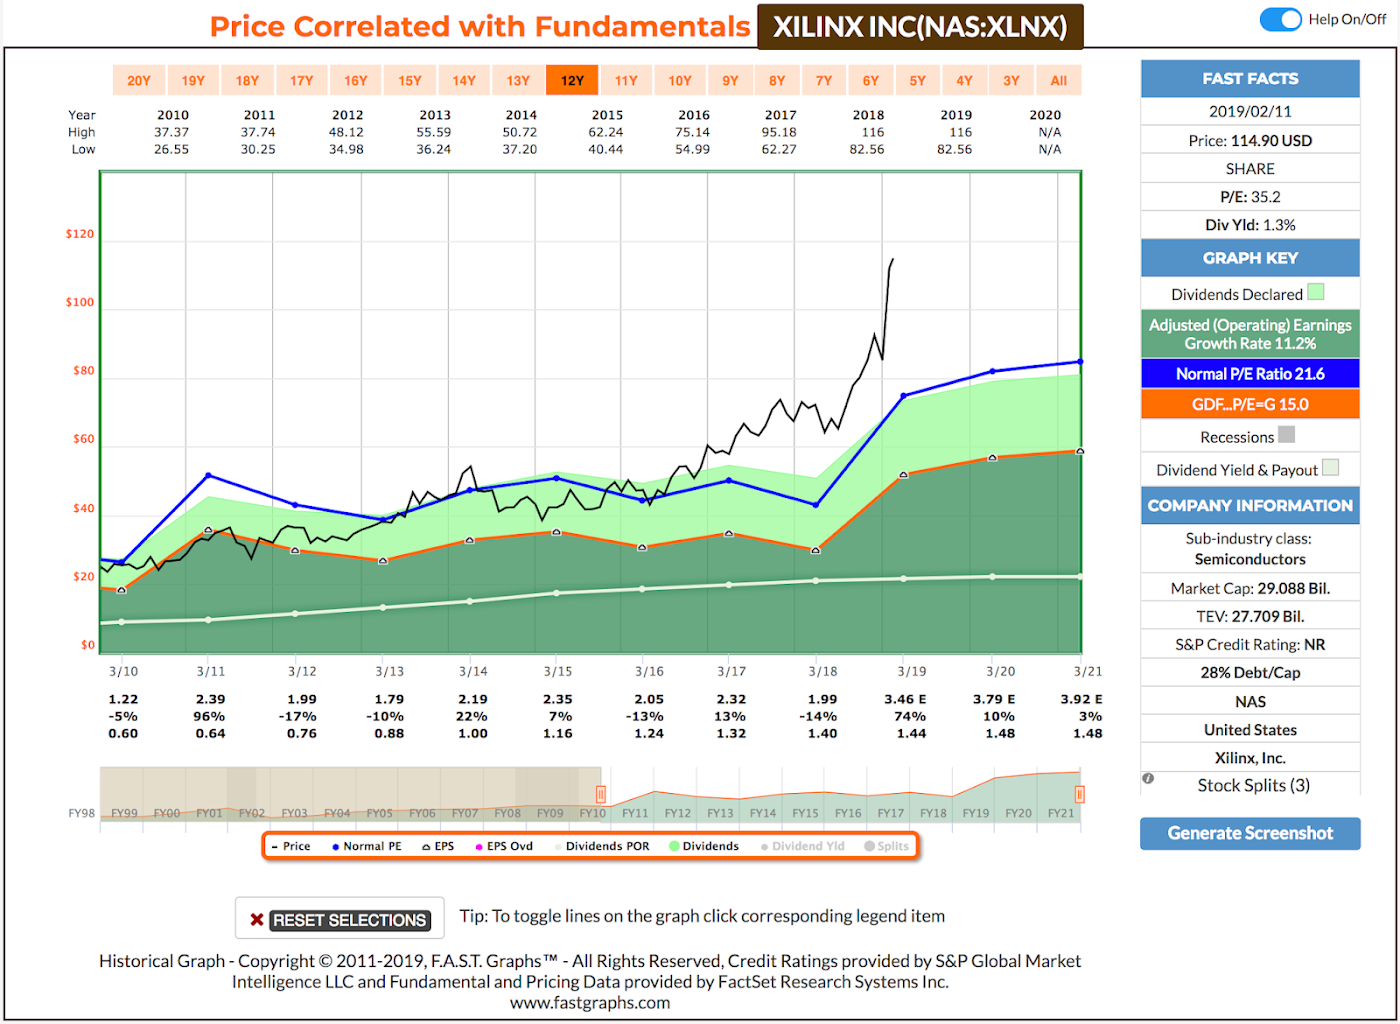
| XLNX | $ 1.44 | 1.27% | 2.37% | 114 | 61 | 51 | 99 |
In the table, stocks trading at or below the Undervalue Target are colored green in the recent price column, and stocks trading at or above the Overvalue Target are colored red in the recent price column.
With its recent stock price about 15% above the overvalue target, Xilinx (XLNX) is the most overvalued stock in the table:
On the other hand, Altria (MO) is the most undervalued stock in the table:
Looking only at the stocks trading in the extreme yield zones, I could improve the overall yield of my portfolio by replacing overvalued stocks with undervalued stocks. Of course, it wouldn't be trivial to do so, as I would need to look at other factors such as the impact on my portfolio's risk profile and portfolio diversification:
|
Ticker Symbol |
Dividend Yield |
Recent Stock Price |
Dividend Streak (Years) |
5-Year DGR |
SSD Safety Score |
S&P Credit Rating |
| T | 6.90% | 30 | 35 | 2.1% | 55 | BBB |
| MO | 6.55% | 49 | 49 | 9.7% | 65 | BBB |
| SKT | 6.26% | 22 | 25 | 9.5% | 75 | BBB+ |
| ABBV | 5.37% | 80 | 7 | 17.5% | 69 | A– |
| D | 5.02% | 73 | 16 | 8.2% | 73 | BBB+ |
| QCOM | 4.93% | 50 | 16 | 13.3% | 65 | A– |
| BLK | 3.21% | 412 | 9 | 12.3% | 95 | AA– |
| AMGN | 3.12% | 186 | 9 | 22.9% | 87 | A |
| PG | 2.94% | 98 | 62 | 3.7% | 98 | AA– |
| ES | 2.88% | 70 | 20 | 6.6% | 88 | A+ |
| XEL | 2.84% | 53 | 15 | 6.4% | 78 | A– |
| NEE | 2.43% | 183 | 24 | 11.0% | 98 | A– |
| XLNX | 1.27% | 114 | 16 | 8.1% | 80 | n/a |
One trade that I'm considering is to close my position in Xilinx (XLNX) and to use the proceeds to increase my position in BlackRock (BLK).
BLK's dividend yield more than doubles the dividend yield of XLNX, the 5-year DGR (dividend growth rate) of BLK is higher, and Simply Safe Dividends gives BLK a higher dividend safety score than for XLNX.

Concluding Remarks
Depending on market conditions, the dividend yield of high-quality dividend growth stocks move in a range between low yields (overvalued) and high yields (undervalued) and tends to revert to the stock's historical average dividend yield.
The historical average dividend yield can be used to estimate a reasonable fair value of a stock, and the dividend range over the same period can be used to establish overvalued and undervalued price targets.
Swapping overvalued stocks for undervalued stocks could be a profitable strategy, but care should be taken to select only high-quality dividend growth stocks of solid, stable businesses.
I'm certainly not advocating that readers only use the average dividend yield method for stock valuation, but it is a useful and quick method for stable, high-quality dividend growth stocks.
Thanks for reading!
Disclaimer: I am not a financial professional. Please consult an investment advisor and do your own due diligence prior to investing. Investing involves risk. Ideas presented in this article are the ...
more

