
The Reason The US Housing Market Is Falling
The hot topic on Wall Street is the weakness in the housing market. The most obvious cause for concern for macro investors stems from the crash in housing stocks. The XHB index which measures the housing market is at a 22 month low. It’s down 22 out of the past 24 trading days and is down 29% since January. Furthermore, the KBE small bank ETF is down 18% from its March high as it is at its 52 week low. The Nasdaq bank index had its worst 5 day RSI in over 20 years. Macro investors are trying to determine if this correction prices in the weakness or if it is a warning sign for an oncoming correction in housing prices.
Home builders are experiencing significant pain because the housing market is weakening, the metals tariffs have increased costs, and the labor market is tight which has heightened wage inflation. The chart below which shows housing starts, is signaling a problem for these firms.
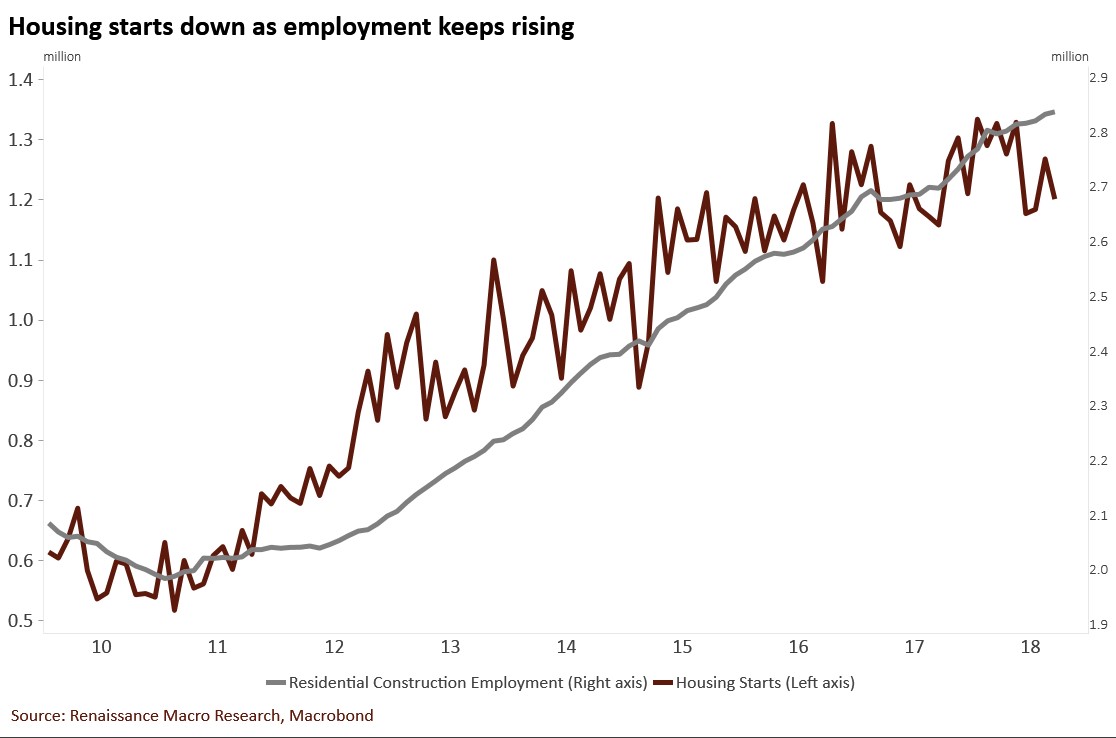
Source: Renaissance Macro Research
The chart shows housing starts have started to fall while residential construction employment has risen. These firms have hired many workers at heightened pay, but are building fewer houses. It’s the worst combination: margin and revenue compression.
Leading Home Price Index Weak
Some investors use stocks as their guide for future economic growth. However, this can only be one guide because the home builder industry faces other negative catalysts besides weakness in the overall market. The ECRI leading index for the overall economy shows year over year growth of only 0.1% which signals a slowdown. The leading home price index growth is even worse as its decline of over 1% is the worst since 2009.
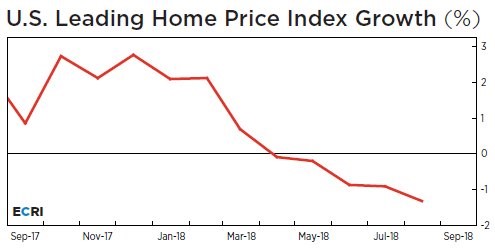
Source: ECRI
Weak Housing Permits
As was shown in the first chart, housing starts have been weak. In the most recent report, housing starts fell from 1.282 million in August to 1.201 million in September. This is seasonally adjusted annualized data, so you can compare each month. Starts fell 13.7% in the Midwest which wasn’t affected by a hurricane and 14% in the south which was affected by hurricane Florence. Building permits fell 1% year over year to 1.241 million. Multi-family housing permits fell 7.8% and single family permits were up 2.4%. As you can see from the Bloomberg chart below, U.S. multi-family housing permits were the weakest since March 2016.
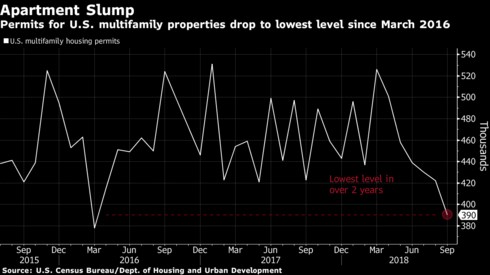
Source: Bloomberg
Housing Unaffordable
We’re seeing real-time weakness in most housing reports. It’s not a surprise that the MBA mortgage applications refinance index fell 3% week over week in the week of October 5th and 9% in the following week because interest rates on 30 year fixed mortgages have increased from 3.88% to 4.85% in the past year. However, the purchase index’s decline of 1% and 6% is disconcerting.
The most obvious question macro investors who didn’t see this weakness coming are asking is “what was the catalyst?” Figuring out the catalyst can help us figure out when the weakness will subside. The biggest catalyst is affordability. As you can see from the Bloomberg chart below, the NAR housing affordability index fell to a 10 year low.
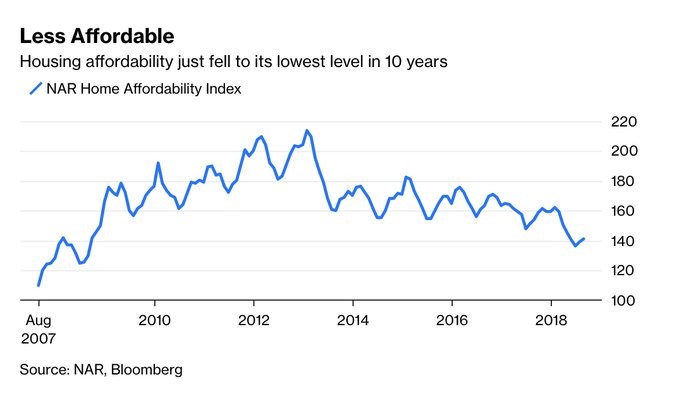
Source: Bloomberg
Consumer confidence is high and wages are growing, but not at the rate necessary to support housing prices. This cycle didn’t have shady lending practices and a boost in subprime loans given to borrowers with low credit ratings, but there has been speculation in some areas like Seattle, Denver, and San Francisco.
Speculation comes and goes in the short-term, but in the long-term house prices are supported by income growth. People will always need a place to live. They will purchase homes if they can afford them. As you can see from the JP Morgan chart below, the home price index has exceeded income growth for the past 5+ years.
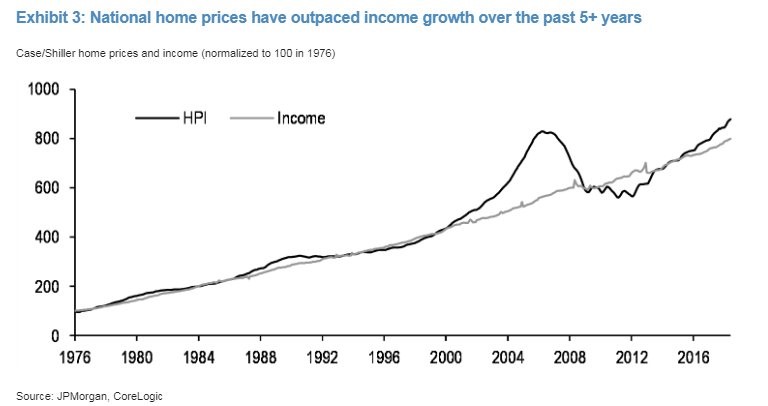
Source: JP Morgan
The increase above incomes isn’t as pronounced as the last bubble, but it does signal price growth will subside. JP Morgan expects home price growth will be 3.3% in 2019. Growth will be lower if interest rates rise or if income growth slows. The fact that home prices are beginning to show signs of weakness is a positive signal that there won’t be another bubble. It’s much better for the cycle to end before crazy speculation occurs. Think about how much softer the last recession would have been if the upswing in home prices ended in 2004 instead of 2007.
The chart below is a scary depiction of where housing prices can fall to.
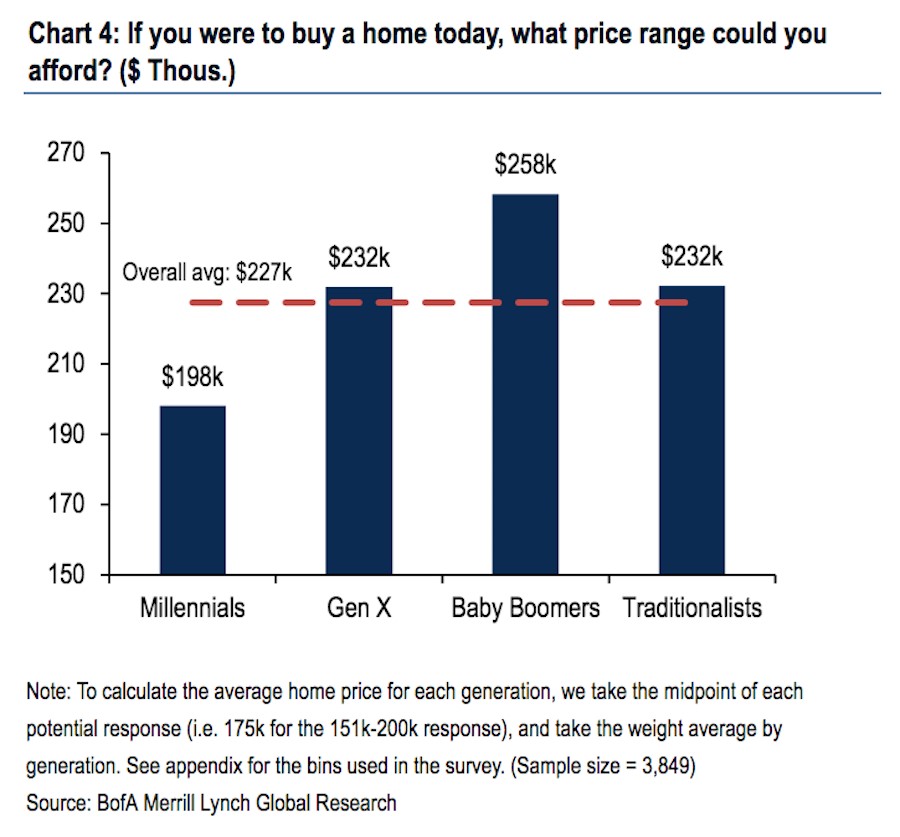
Source: Bank of America
Millennials, which is the biggest generation of potential home buyers, only say they can afford a house that costs $198,000 which is $29,000 below the overall average. There are set to be more millennials than baby boomers in 2019 and there are already more than generation Xers. Millennials are 42% of home buyers and 62% of first time home buyers.
As millennials get older and grow their wealth, they will be able to afford higher priced houses. As for now, this chart is scary because the median sales price of homes in August 2018 was $309,800. Millennials, on average, can’t come close to affording the median house. Baby boomers are the closest to affording the median house, but that’s only relevant for investments because they are much older.
Glimmer Of Hope
We showed many negative charts in this article. We’ll leave you with a positive one. The housing market index, which measures home builder sentiment, increased from 67 to 68 in October. This was the first increase since July. As you can see in the chart below, there was a 4 point rise in traffic to 53 which is the best reading since February.
(Click on image to enlarge)
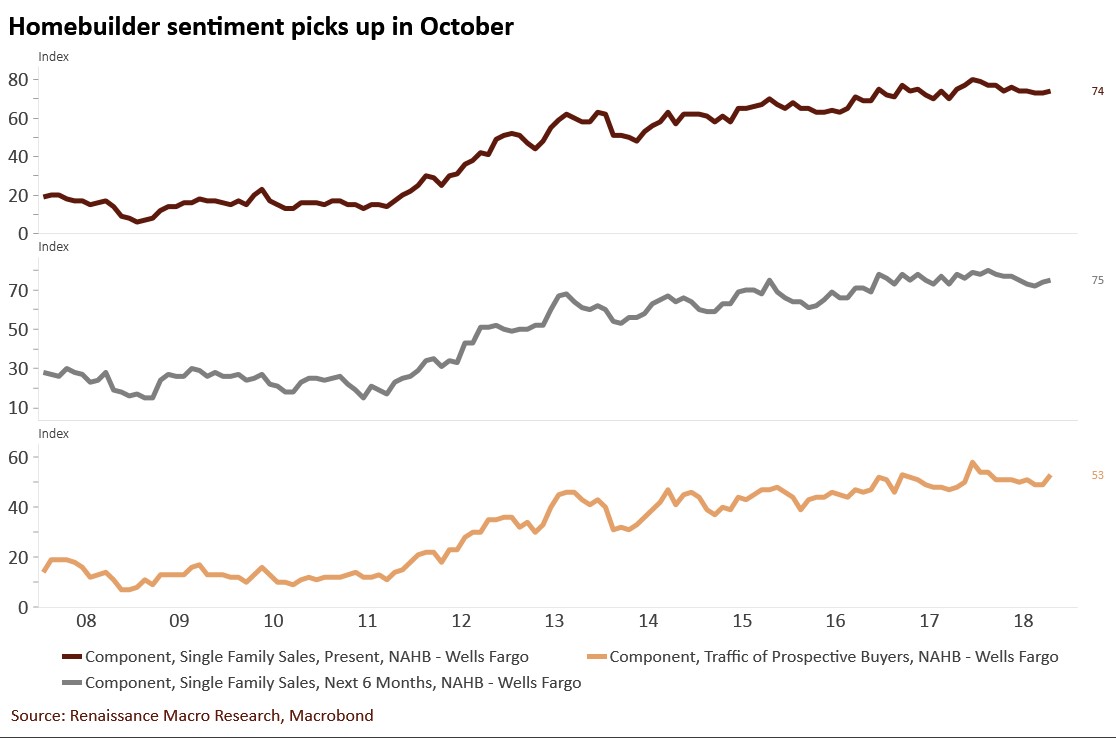
Source: Renaissance Macro Research
Present sales and 6 month sales were up 1 point each. The best region was the west which had a 3 month composite of 74. Second place was the south at 71. The Midwest and northeast were in last at 57.
Conclusion
Housing isn’t affordable. The average millennial can’t even afford to pay $200k for a house when the median one costs above $300k. Housing prices could fall year over year if income growth slows and interest rates rise further. The Fed is hiking rates at a quicker speed which is beginning to become problematic for housing again. The best solace for macro investors is the housing price growth above income growth isn’t as divergent as it was during the last cycle. There hasn’t been a prevalence of zero document loans with adjustable rates this cycle either.
Disclaimer: Please familiarize yourself with our full disclaimer here.


