
Rainbows Follow The Storm - Energy Earnings Estimates/Revisions
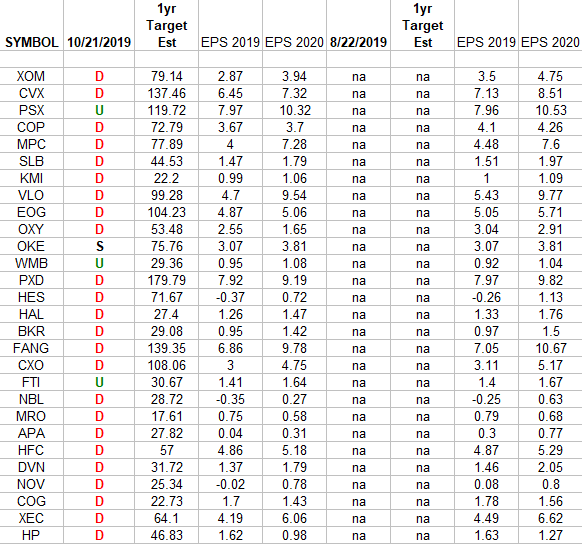
In the spreadsheet above I have tracked the earnings estimates for the Energy Sector ETF (XLE).
The column under the date 10/21/2019 has a letter that represents the movement in 2019 earnings estimates since the most recent print (8/22/2019). “U” means 2019 estimates are UP in the last 60 days. “D” means 2019 estimates are DOWN in the last 60 days. “S” means 2019 estimates have remained the SAME in the last 60 days. The column entitled “1yr Target Est” is the Wall Street consensus 12 month price target for each stock.
What this table is telling us is that estimates have decreased in the past 60 days. More estimates came DOWN for 2019 in the past 30 days than went UP – Down:Up – 24:3 ratio. The rest remained the same.
The bad news is, the cumulative 2019 earnings power of these stocks was revised DOWN by -6.14% in the past 60 days.
The good news is that 2020 Earnings estimates are +30.66% higher for these 28 stocks than for 2019. If half of that growth estimate holds, it could be a boon to the sector.
We wrote an extensive article about the opportunity in the Exploration and Production sub-sector last week – that was one of our most trafficked articles of the week. You can find it here.
Disclaimer: Not investment advice. For educational purposes only: https://www.hedgefundtips.com/terms-of-use/


