
Rail Week September 2019 Intuitive Sectors Marginally Worsen
Week 38 of 2019 shows same week total rail traffic (from same week one year ago) contracted according to the Association of American Railroads (AAR) traffic data. The economically intuitive sectors rolling averages remain in contraction - and were little changed this week.

Analyst Opinion of the Rail Data
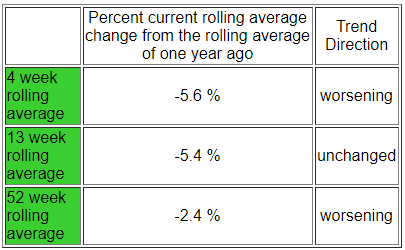
We review this data set to understand the economy. The intuitive sectors (total carloads removing coal, grain, and petroleum) contracted 4.6 % year-over-year for this week. We primarily use rolling averages to analyze the intuitive data due to weekly volatility - and the 4 week rolling year-over-year average for the intuitive sectors worsened from -4.3 % to -4.9 %.
When rail contracts, it suggests a slowing of the economy.
The following graph compares the four-week moving averages for carload economically intuitive sectors (red line) vs. total movements (blue line):
(Click on image to enlarge)

Intermodal transport (containers or trailers on rail cars) growth was relatively strong until the beginning of 2019 - and now the year-to-date growth is deep in contraction.
This analysis is looking for clues in the rail data to show the direction of economic activity - and is not necessarily looking for clues of profitability of the railroads. The weekly data is fairly noisy, and the best way to view it is to look at the rolling averages (carloads [including coal and grain] and intermodal combined).
(Click on image to enlarge)
A summary for this week from the AAR:
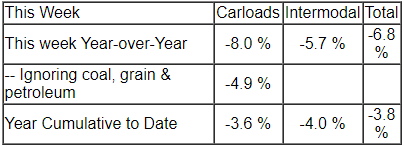
For this week, total U.S. weekly rail traffic was 528,670 carloads and intermodal units, down 6.8 percent compared with the same week last year.
Total carloads for the week ending September 21 were 250,794 carloads, down 8 percent compared with the same week in 2018, while U.S. weekly intermodal volume was 277,876 containers and trailers, down 5.7 percent compared to 2018.
One of the 10 carload commodity groups posted an increase compared with the same week in 2018. It was chemicals, up 532 carloads, to 32,280. Commodity groups that posted decreases compared with the same week in 2018 included coal, down 9,194 carloads, to 78,881; grain, down 4,300 carloads, to 19,018; and metallic ores and metals, down 2,122 carloads, to 21,905.
For the first 38 weeks of 2019, U.S. railroads reported cumulative volume of 9,613,796 carloads, down 3.6 percent from the same point last year; and 10,111,040 intermodal units, down 4 percent from last year. Total combined U.S. traffic for the first 38 weeks of 2019 was 19,724,836 carloads and intermodal units, a decrease of 3.8 percent compared to last year.
The middle row in the table below removes coal, grain, and petroleum from the changes in the railcar counts as these commodities are not economically intuitive.
(Click on image to enlarge)
(Click on image to enlarge)

Disclaimer: No content is to be construed as investment advise and all content is provided for informational purposes only.The reader is solely responsible for determining whether any investment, ...
more

