
Rail Week Ending Saturday, May 29 - May Rail Movements Up 28% Year-over-Year
Week 21 of 2021 shows the same week total rail traffic (from the same week one year ago) improved according to the Association of American Railroads (AAR) traffic data. Total rail traffic is now surging as it is being compared to the pandemic lockdown period one year ago.

Analyst Opinion of the Rail Data
We are now seeing great rail growth as the data is being compared to the coronavirus lockdown period last year.
Total rail traffic has two components - carloads and intermodal (containers or trailers on rail cars). This week again both carloads and intermodal continued in expansion year-over-year - with the rate of acceleration of growth slowing.
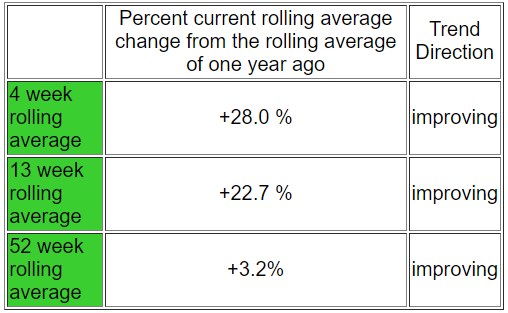
We review this data set to understand the economy. The intuitive sectors (total carloads removing coal, grain, and petroleum) expanded 34.0 % year-over-year for this week. We primarily use rolling averages to analyze the intuitive data due to weekly volatility - and the 4 week rolling year-over-year average for the intuitive sectors was little changed at +35.5 %
When rail contracts, it suggests a slowing of the economy.
The following graph compares the four-week moving averages for carload economically intuitive sectors (red line) vs. total movements (blue line):

.
This analysis is looking for clues in the rail data to show the direction of economic activity - and is not necessarily looking for clues of the profitability of the railroads. The weekly data is fairly noisy, and the best way to view it is to look at the rolling averages (carloads [including coal and grain] ).
A summary for this week from the AAR:
U.S. railroads originated 964,356 carloads in May 2021, up 30.4 percent, or 224,623 carloads, from May 2020. U.S. railroads also originated 1,151,824 containers and trailers in May 2021, up 26.2 percent, or 238,927 units, from the same month last year. Combined U.S. carload and intermodal originations in May 2021 were 2,116,180, up 28 percent, or 463,550 carloads and intermodal units from May 2020.
In May 2021, 18 of the 20 carload commodity categories tracked by the AAR each month saw carload gains compared with May 2020. These included: coal, up 77,228 carloads or 41.7 percent; motor vehicles & parts, up 34,021 carloads or 206.5 percent; and chemicals, up 23,368 carloads or 20.8 percent. Commodities that saw declines in May 2021 from May 2020 included: farm products excluding grain, down 166 carloads or 4.9 percent; and primary forest products, down 67 carloads or 1.7 percent.
"U.S. rail volumes in May 2021 were encouraging. Total carloads were the most for any month since October 2019 on a weekly average basis," said AAR Senior Vice President John T. Gray. "In May, 18 of the 20 carload categories we track had carload gains over May 2020, while 12 of the 20 had gains over May 2019. Meanwhile, intermodal just had the best January to May period ever for U.S. railroads. Railroads hope to build on these gains in the months ahead as they help the economy return to strong, sustainable growth."
Excluding coal, carloads were up 147,395 carloads, or 26.6 percent, in May 2021 from May 2020. Excluding coal and grain, carloads were up 131,319 carloads, or 28 percent.
Total U.S. carload traffic for the first five months of 2021 was 4,827,293 carloads, up 7.3 percent, or 329,416 carloads, from the same period last year; and 5,945,322 intermodal units, up 19.2 percent, or 957,198 containers and trailers, from last year.
Total combined U.S. traffic for the first 21 weeks of 2021 was 10,772,615 carloads and intermodal units, an increase of 13.6 percent compared to last year.
Week Ending May 29, 2021
Total U.S. weekly rail traffic was 530,225 carloads and intermodal units, up 34 percent compared with the same week last year.
Total carloads for the week ending May 29 were 243,304 carloads, up 35.3 percent compared with the same week in 2020, while U.S. weekly intermodal volume was 286,921 containers and trailers, up 33 percent compared to 2020.
All of the 10 carload commodity groups posted an increase compared with the same week in 2020. They included coal, up 20,616 carloads, to 66,651; metallic ores and metals, up 11,742 carloads, to 24,396; and chemicals, up 7,312 carloads, to 34,016.
The middle row in the table below removes coal, grain, and petroleum from the changes in the railcar counts as these commodities are not economically intuitive.

(Click on image to enlarge)

Disclaimer: No content is to be construed as investment advise and all content is provided for informational purposes only.The reader is solely responsible for determining whether any investment, ...
more

